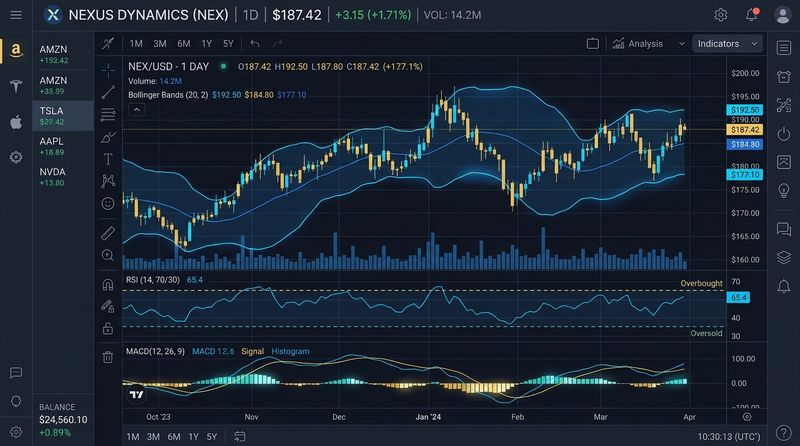
Imagine setting a stop-loss order at a fixed percentage, say 2%, below your purchase price on two different stocks. Stock A is a stable large-cap utility company that typically moves less than 0.5% a day. Stock B is a high-growth, highly volatile technology start-up that routinely moves 4% daily. Within a few hours, Stock B spikes downward, hits your stop-loss, knocks you out of the trade, and then instantly rockets upward without you. Your stop-loss was too tight for Stock B's volatility. To avoid this, you must use the Average True Range (ATR) indicator.
Developed by legendary technical analyst J. Welles Wilder Jr. in 1978, the ATR is not a trend indicator or a momentum oscillator. It is a pure measure of market volatility. It doesn't tell you which way the price is going; it simply tells you how much the price is moving. By measuring the historical volatility of an asset, the ATR allows traders to set dynamic, logical stop-losses and determine the correct position size for any trade.
How is the Average True Range Calculated?
To calculate the ATR, you must first find the "True Range" (TR) for each period. The True Range is the greatest of the following three values:
- The distance from today's high to today's low.
- The distance from yesterday's close to today's high (capturing gaps).
- The distance from yesterday's close to today's low (capturing gaps).
By accounting for overnight price gaps, the True Range is a far more accurate representation of volatility than simply looking at the daily high-low range. The ATR is then calculated as a moving average of these True Range values, typically using a 14-period lookback.
Volatility-Based Stop-Loss Placement
The primary use of the ATR is setting logical, volatility-adjusted stop-loss levels. Instead of choosing an arbitrary percentage like 2% or 5%, traders set their stop-losses as a multiple of the ATR. This ensures that the stop-loss is placed outside the asset's normal "noise" level.
1. The ATR Multiplier Stop
A common formula for a long position is placing the stop-loss at 2 times the ATR (2x ATR) below the entry price:
For example, if you buy a stock at ₹500, and the current 14-day ATR is ₹15, your stop-loss would be placed at:
This ensures that the stock would have to make an unusual, statistically significant move against you to trigger the stop-loss, protecting you from being knocked out of trades by normal daily volatility.
2. The Chandelier Exit (Trailing Stop)
Developed by Chuck LeBeau, the Chandelier Exit is a trailing stop-loss that hangs from the highest high the stock has reached since you entered the trade. The formula is:
As the stock price rises and makes new highs, the trailing stop automatically moves up, locking in profits. If the stock corrects by more than three times its average volatility, it triggers an exit signal, indicating that the uptrend has likely broken down.
| Asset Volatility | ATR Value | Stop Loss Distance | Position Size Strategy |
|---|---|---|---|
| Low Volatility | Small ATR value | Tight stop-loss allowed | Larger number of shares (low risk per share) |
| High Volatility | Large ATR value | Wide stop-loss required | Smaller number of shares (high risk per share) |
Using ATR for Volatility-Adjusted Position Sizing
Position sizing is the key to long-term trading survival. Professional risk management dictates that you should never risk more than 1% or 2% of your total account capital on a single trade. By combining this rule with the ATR, you can adjust your position size based on the asset's risk profile. The formula is:
If you have a ₹10,000,000 portfolio and choose to risk 1% (₹100,000) on a trade:
- For a low-volatility stock with a stop distance of ₹10, you can buy:
₹100,000 / ₹10 = 10,000 shares. - For a high-volatility stock with a stop distance of ₹50, you can buy:
₹100,000 / ₹50 = 2,000 shares.
This ensures that no matter how volatile the stock is, your total capital risk remains exactly 1% if the stop-loss is hit.
Practical Action Steps for Risk Management
- Add ATR to your charts: Look up the 14-day ATR value on any stock before placing a trade. Calculate the stop-loss before you commit any capital.
- Avoid fixed percentage stops: Never use a generic "5% stop" for all stocks. A 5% stop is too wide for stable utilities and too tight for volatile small-caps.
- Monitor ATR changes: If the ATR of a stock starts rising sharply, it indicates that volatility is expanding. Reduce your position sizes on new entries to keep your risk under control.
Conclusion
The Average True Range is a fundamental risk management tool that converts price volatility into a clear, mathematical metric. By implementing volatility-based stop-losses, using trailing stops like the Chandelier Exit, and adjusting your position sizes based on historical ranges, you can survive market swings and protect your compounding portfolio. Remember, long-term success in investing is not about how much you make when you win, but how effectively you limit your losses when you are wrong.
Educational & Regulatory Disclaimer
This publication is created strictly for educational and financial literacy purposes. InnocentInvestor is not a SEBI-registered investment advisor or research analyst. Stock market investments are subject to market risks; please consult a qualified financial planner before making investment decisions.
