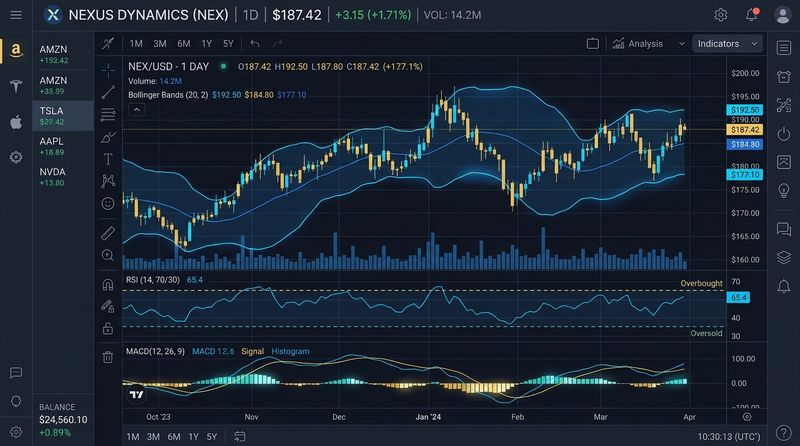
Imagine the stock market as a breathing organism. It contracts, drawing in its breath during periods of quiet calmness, and then expands, exhaling sharply with explosive price action. This cycle of quiet consolidation and high-volatility breakouts repeats endlessly across every asset class. Bollinger Bands are a technical analysis tool designed specifically to measure this contraction and expansion, giving traders a map of when the market is quiet and when it is about to explode.
Developed in the early 1980s by legendary technician John Bollinger, this indicator is unique because it adapts dynamically to changing market conditions. Unlike fixed bands that remain at static distances, Bollinger Bands expand during volatile markets and contract during quiet markets. This adaptability makes them one of the most powerful tools for trading volatility breakouts and mean reversion setups.
The Structure of Bollinger Bands
Bollinger Bands are plotted directly on the price chart and consist of three distinct bands:
- Middle Band: This is a simple moving average, typically set to a 20-period Simple Moving Average (SMA). It establishes the baseline trend of the stock.
- Upper Band: This line is plotted above the middle band. It is calculated by adding a specific number of standard deviations to the 20-period SMA. By default, it is set to 2 standard deviations above.
- Lower Band: This line is plotted below the middle band. It is calculated by subtracting 2 standard deviations from the 20-period SMA.
Standard deviation is a statistical measure of volatility. By placing the bands two standard deviations away from the 20-day SMA, John Bollinger created a dynamic envelope. Under normal distribution, approximately 95% of all price action should occur within these two bands. When the price moves outside the bands, it represents a statistically significant anomaly.
Two Classical Bollinger Band Strategies
Traders utilize Bollinger Bands in two primary ways, depending on whether the market is consolidating or breakout-ready:
1. The Volatility Squeeze (Breakout Trading)
The "Squeeze" is John Bollinger’s favorite setup. It occurs when market volatility drops to extreme lows, causing the upper and lower bands to contract closely together. This shows that the market is in a tight consolidation phase.
Because low volatility always leads to high volatility, the squeeze is a warning that a massive price move is coming. Traders watch for the price to close outside one of the bands:
- A daily close above the upper band signals a bullish breakout. Traders enter long.
- A daily close below the lower band signals a bearish breakout. Traders enter short.
To avoid false breakouts, traders often look for confirmation from volume indicators or momentum oscillators like the RSI.
2. Mean Reversion (The Bollinger Bounce)
In range-bound markets, Bollinger Bands act like rubber bands. When the price is stretched to the outer edge of a band, it tends to snap back toward the middle band (mean reversion). Here is how traders execute the Bollinger Bounce:
- When the price touches the lower band, and a bullish reversal candlestick (like a hammer) forms, it indicates that the stock is short-term oversold. Traders buy, targeting the middle band (20 SMA) or the upper band.
- When the price touches the upper band, and a bearish reversal candlestick (like a shooting star) forms, it indicates that the stock is short-term overbought. Traders sell or exit, targeting the middle band.
| Market Condition | Band Behavior | Core Strategy | Target Objective |
|---|---|---|---|
| Consolidating / Range-bound | Bands are narrow and flat | Mean Reversion (Bollinger Bounce) | Opposite Band / Middle 20 SMA |
| Breakout / Trending | Bands expand rapidly (opening mouth) | Volatility Squeeze Breakout Entry | Ride the outer band |
The W-Bottom and M-Double Top Breakouts
John Bollinger identified that classic chart patterns become much more reliable when filtered through the bands. The W-Bottom (Double Bottom) pattern is a prime example:
- The price pulls down and touches or breaches the lower band, establishing the first low.
- The price bounces back toward the middle band.
- The price pulls down to make a second low, but this low stays above the lower band, indicating that selling pressure is weakening.
- The price breaks above the intermediate peak, triggering a high-probability buy signal.
The opposite pattern is the M-Double Top, which is used to identify trend exhaustion at market peaks.
Risk Management and Common Mistakes
The most common mistake traders make is assuming that a touch of the band is an automatic signal. A stock can "walk the band" during a strong trend, staying pinned to the upper or lower band for many days. Shorting a stock simply because it touched the upper band during a powerful bull market is a recipe for heavy losses.
To manage risk, always wait for price confirmation (reversal candlesticks) before entering mean reversion trades. Additionally, look at the slope of the bands. If the bands are sloping sharply upward, do not take short trades, even if the price is above the upper band.
Step-by-Step Action Plan
- Identify a Squeeze: Scan your watchlist for stocks where the bands are at their narrowest width in the last six months. These are candidates for a massive breakout.
- Combine with an oscillator: Plot the Bollinger Bands and the RSI together. If the price is touching the upper band but the RSI shows a bearish divergence, the probability of a reversal is extremely high.
- Practice trailing stops: During a breakout trade, use the middle band (20 SMA) as a dynamic trailing stop-loss to ride the trend as long as possible.
Conclusion
Bollinger Bands are a dynamic, mathematically sound tool that translates market volatility into actionable trading zones. By mastering the squeeze breakout, capitalizing on mean reversion bounces, and verifying double bottoms and double tops, you can navigate both trending and range-bound markets with precision. Always pair the bands with trend direction and volume verification to maximize your edge.
Educational & Regulatory Disclaimer
This publication is created strictly for educational and financial literacy purposes. InnocentInvestor is not a SEBI-registered investment advisor or research analyst. Stock market investments are subject to market risks; please consult a qualified financial planner before making investment decisions.
