In the 18th century, a legendary Japanese merchant named Munehisa Homma became incredibly wealthy trading rice. He realized that while supply and demand dictated prices, the market was also heavily influenced by the emotions of the traders. To visualize this human battle, he developed a charting system that we still use today: Japanese Candlesticks.
Compared to standard line charts (which only show closing prices) or bar charts (which can look cluttered), candlesticks provide a highly visual, instant story of market momentum. By looking at a single candlestick, a trader can immediately tell who won the battle during that time period—the buyers or the sellers. This guide will break down the anatomy of a candlestick and teach you how to decode their signals.
Anatomy of a Candlestick: The OHLC Model
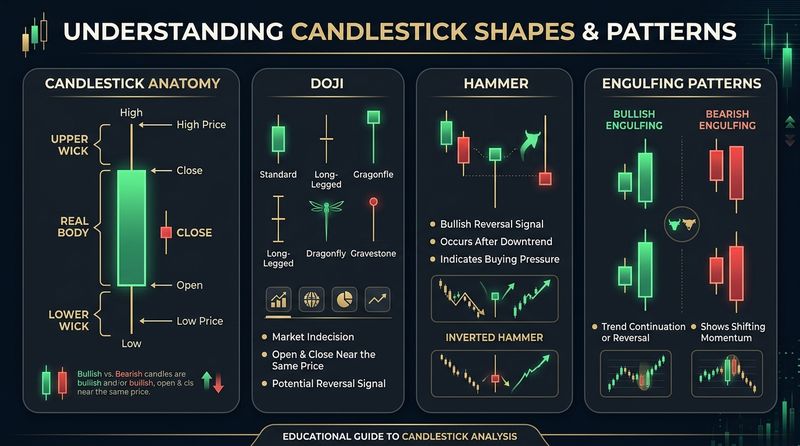
Every candlestick represents price action over a specific timeframe (e.g., 5 minutes, 1 hour, or 1 day). A candlestick consists of three parts: the **Real Body**, the **Upper Shadow (wick)**, and the **Lower Shadow (tail)**.
These components display four critical data points, known as the **OHLC** model:
- Open: The price at which the time period started.
- High: The highest price reached during the time period.
- Low: The lowest price reached during the time period.
- Close: The price at which the time period ended.
Bullish vs. Bearish Candles
If the closing price is higher than the opening price, the candlestick is **Bullish** (typically colored green or white). This indicates buyers successfully drove the price up.
If the closing price is lower than the opening price, the candlestick is **Bearish** (typically colored red or black). This indicates sellers pushed the price down.
Decoding the Story: How to Read the Candles
Instead of memorizing dozens of weird pattern names, you can read almost any candlestick by looking at its two key characteristics: the **size of the body** and the **length of the wicks**.
1. Size of the Real Body (Momentum)
The real body shows the distance between the open and the close.
A **large real body** indicates strong momentum. If a candle is long and green, it shows that buyers dominated the entire session, aggressively pushing the price up.
A **small real body** indicates indecision. Neither buyers nor sellers were able to move the price significantly from its starting point.
2. Length of the Shadows / Wicks (Rejection)
The shadows represent the extreme highs and lows that occurred during the session but were rejected.
A **long upper shadow** indicates that buyers tried to push the price up, but sellers stepped in and aggressively drove the price back down before the session ended. This is a sign of bearish rejection.
A **long lower shadow** indicates that sellers pushed the price down, but buyers stepped in, absorbed the supply, and drove the price back up. This is a sign of bullish rejection.
Basic Candlestick Classifications
| Candlestick Type | Visual Profile | Market Meaning | Trend Implication |
|---|---|---|---|
| Marubozu | Large body, virtually no wicks. | Extreme trend dominance from start to finish. | Continuation of current trend. |
| Pin Bar / Hammer | Small body, long lower/upper shadow. | Strong rejection of low or high prices. | Reversal of current move. |
| Doji | Tiny line body, balanced wicks. | Complete balance between buyers and sellers. | Indecision; potential trend pause. |
| Spinning Top | Small body, symmetrical moderate wicks. | Consolidation; cooling off period. | Neutral; waiting for breakout. |
How to Trade Candlesticks: The Core Rule
The biggest trap for beginner traders is treating every candlestick pattern as an immediate trade trigger. If you see a bullish hammer on a chart and buy immediately, you will lose money. Why? Because you ignored **context**.
Context is King. Candlesticks are the trigger.
Think of candlesticks like a light switch. A light switch is useless unless it is wired to a light bulb and a power source. Similarly, a candlestick pattern is only useful when it is located at a key structural level on your chart:
- A bullish Hammer is only traded when it forms at a major **Support Zone** in an uptrend.
- A bearish Shooting Star is only traded when it forms at a major **Resistance Zone** in a downtrend.
If you spot these patterns in the middle of a trading range (no-man's land), ignore them. They are simply noise.
Common Mistakes in Candlestick Trading
- Trading on Low Timeframes: Candlestick patterns on a 1-minute or 5-minute chart have very low reliability because they are driven by temporary noise. Focus your analysis on the 4-Hour (H4) and Daily (D1) charts, where the wicks represent significant, institutional decisions.
- Entering Before the Candle Closes: This is a fatal mistake. A candle might look like a perfect hammer with a long tail 5 minutes before the hourly close. However, a sudden burst of selling in the final minutes can push the price down, turning it into a bearish Marubozu. Never trade a pattern until the candle is **fully closed**.
- Ignoring the Trend: Do not try to trade a bullish reversal candle when the market is in a structural waterfall crash. Let the market settle first. Always trade in alignment with the dominant trend.
Conclusion
Japanese candlesticks are a window into the souls of market participants. By understanding the OHLC structure, studying body size for momentum, and looking at wicks for price rejection, you can read the story behind any chart. Just remember to always combine candlesticks with key support and resistance zones to keep your trading safe and statistically profitable.
Educational & Regulatory Disclaimer
This publication is created strictly for educational and financial literacy purposes. InnocentInvestor is not a SEBI-registered investment advisor or research analyst. Stock market investments are subject to market risks; please consult a qualified financial planner before making investment decisions.
