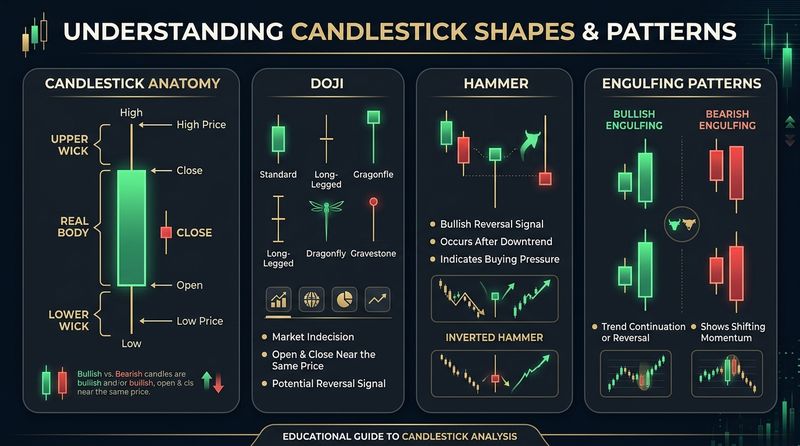
Have you ever watched a stock plummet during a session, only for it to snap back rapidly in the final hour and close near its opening price? This dramatic price action leaves behind a long vertical tail with a tiny square body on top. In technical analysis, this is the legendary Hammer. Along with its quiet cousin, the Doji, these single-candlestick patterns are the most powerful reversal signals on a trading chart.
For retail investors, hammers and dojis are the keys to identifying when a market has reached exhaustion. Rather than guessing when a trend is ending, these candles provide visual proof of price rejection, allowing you to enter trades with surgical entry points and highly defined risk limits.
The Doji Family: The Pivot Points of Indecision
A Doji is formed when the opening price and closing price of a session are virtually identical. Because the body is tiny or nonexistent, a Doji looks like a cross, a plus sign, or a horizontal line. While it primarily represents indecision, its variation can signal powerful reversals:
1. The Standard Doji
A standard Doji has symmetrical upper and lower wicks. It indicates that both buyers and sellers tried to push the price in their respective directions, but by the end of the session, the price returned to the exact starting point. It represents complete market equilibrium. In a strong trend, a standard Doji suggests a pause, indicating that the trend is losing steam.
2. The Dragonfly Doji (Bullish Reversal)
The Dragonfly Doji has a long lower wick and no upper wick. The open, high, and close are all at the very top of the candle.
Market Meaning: Sellers aggressively drove the price down during the session, but buyers stepped in with overwhelming force, driving the price all the way back to the open. This represents a massive rejection of lower prices.
3. The Gravestone Doji (Bearish Reversal)
The Gravestone Doji is the exact opposite of the Dragonfly. It has a long upper wick and no lower wick. The open, low, and close are all at the very bottom of the candle.
Market Meaning: Bulls pushed the price high during the session, but sellers stepped in, rejected the high prices, and slammed the price back to the open. This represents a massive rejection of higher prices.
The Hammer and Shooting Star: Rejection in Action
Unlike a Doji, a Hammer has a small real body at one end of the candle and a long wick at the other. For a candle to qualify as a Hammer, the wick must be **at least twice the length of the real body**.
1. The Classic Hammer
A Classic Hammer forms at the bottom of a downtrend. It has a small real body (bullish or bearish, though a bullish green body is stronger) at the top of the candle, a long lower wick, and little to no upper wick.
Psychology: Sellers were in complete control, pushing the price to new lows. However, institutional buyers recognized the asset was undervalued, stepping in with large purchase orders. The price closed near the session high. The downtrend is exhausted.
2. The Inverted Hammer
An Inverted Hammer also forms at the bottom of a downtrend, but it has a small body at the bottom and a long upper wick. It indicates that buyers have begun to fight back, and although they couldn't hold the highs, they have successfully stopped the downward momentum.
3. The Shooting Star
A Shooting Star is a bearish reversal candle that forms at the peak of an uptrend. It has a small body at the bottom of the candle and a long upper wick. It is the visual depiction of bulls failing to hold a breakout, indicating that a market top is in place.
Summary of Key Reversal Candlesticks
| Pattern | Trend Context | Rejection Type | Trading bias |
|---|---|---|---|
| Dragonfly Doji | Bottom of downtrend. | Bullish rejection of lows. | Bullish Reversal |
| Classic Hammer | Bottom of downtrend. | Bullish rejection of lows. | Bullish Reversal |
| Gravestone Doji | Peak of uptrend. | Bearish rejection of highs. | Bearish Reversal |
| Shooting Star | Peak of uptrend. | Bearish rejection of highs. | Bearish Reversal |
Practical Trading Strategies
To turn these patterns into a profitable trading system, you must follow the golden rule of price action: **never trade them in isolation**. A hammer in the middle of a sideways range is useless. A hammer at a daily support zone is gold.
Strategy 1: The Hammer at Key Support
Use this strategy to buy dip opportunities in an uptrend:
1. Draw major horizontal support levels on your chart.
2. Wait for the price to pull back to the support zone.
3. Look for a Hammer or Dragonfly Doji to close cleanly inside the support zone.
4. **Execution:** Enter long on the close of the Hammer. Place your stop loss 2-3 pips/cents below the lowest point of the Hammer's wick. Set your profit target at the next resistance level.
Strategy 2: The Shooting Star at Key Resistance
Use this strategy to short overvalued peaks:
1. Identify a major resistance ceiling on your chart.
2. Wait for the price to rally into this resistance zone.
3. Look for a Shooting Star or Gravestone Doji to close inside the zone, showing rejection of the highs.
4. **Execution:** Enter a short position on the close of the candle. Place your stop loss just above the tip of the upper wick. Set your profit target at the support floor.
Crucial Mistakes to Avoid
- Failing to Wait for the Close: Many traders enter a trade while the candle is still forming. A candle can look like a perfect hammer with a long wick, but in the final 30 seconds, it can fill up and close as a bearish candle. **Always wait for the close.**
- Placing Stops Too Tight: Place your stop loss below the extreme wick point, not the body. The wick represents the boundary of price rejection; if the market breaks past the wick, your trade idea is officially invalidated.
- Trading on Low Timeframes: A hammer on a 1-minute chart has no significance. Focus on the Daily (D1) or 4-Hour (H4) charts, where the wicks represent major institutional transactions.
Conclusion
Doji and Hammer candlesticks are the ultimate visual maps of price rejection. By training your eyes to spot Dragonfly Dojis, Gravestones, Hammers, and Shooting Stars, you can stop guessing where trends end. By combining these patterns with clear horizontal support and resistance zones, you can execute reversal trades with tight risk control and high statistical probabilities.
Educational & Regulatory Disclaimer
This publication is created strictly for educational and financial literacy purposes. InnocentInvestor is not a SEBI-registered investment advisor or research analyst. Stock market investments are subject to market risks; please consult a qualified financial planner before making investment decisions.
