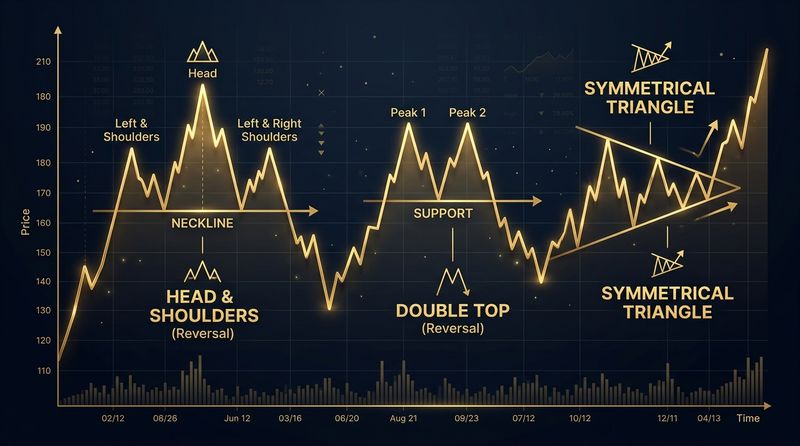
Have you ever watched a stock rally with absolute confidence, only to hit an invisible wall, retreat, try again, fail at the exact same spot, and then collapse? If you have, you've witnessed a Double Top in action. Conversely, watching a falling asset hit rock bottom twice before rocketing upward is the hallmark of a Double Bottom.
Double tops and double bottoms are two of the most common, powerful, and easily recognizable reversal formations in technical analysis. Often referred to by traders as "M" and "W" patterns due to their visual shape, these structures represent a critical failure of the dominant trend. By learning how to trade them, retail investors can spot trend endings and position themselves for the new trend's birth.
The Anatomy of a Double Top (Bearish Reversal)
A Double Top is a bearish reversal pattern that forms after a sustained upward trend. It consists of the following components:
- Peak 1: The price reaches a new high of the uptrend and pulls back. This pullback establishes a temporary support level.
- The Valley (Neckline): The lowest point of the pullback between the two peaks. A horizontal line drawn through this point serves as the "Neckline."
- Peak 2: The price rallies back up, testing the level of Peak 1. However, selling pressure rises, and the price fails to break above Peak 1. The price starts falling back toward the Valley.
- Trigger (Breakout): The pattern is confirmed only when the price breaks below the Neckline.
The Anatomy of a Double Bottom (Bullish Reversal)
A Double Bottom is the exact mirror image of a Double Top. It is a bullish reversal pattern that forms at the end of a downtrend:
- Trough 1: The price falls to a new low and bounces back. This bounce establishes a temporary resistance level.
- The Peak (Neckline): The highest point of the bounce between the two troughs. A horizontal line drawn through this peak serves as the Neckline.
- Trough 2: The price falls back down, testing the level of Trough 1. Buyers step in, preventing the price from breaking below the first trough. The price starts rising back toward the Neckline.
- Trigger (Breakout): The pattern is confirmed only when the price breaks above the Neckline.
The Market Psychology Behind "M" and "W" Patterns
To master these patterns, we must look past the lines and understand the human actions driving them. Let's analyze a Double Top:
In an uptrend, every pullback is bought, creating higher highs. When Peak 1 is formed, buyers assume the next rally will result in another higher high. However, when Peak 2 fails to surpass Peak 1, it sends a wave of anxiety through the market. Bulls realize that they no longer have the strength to push prices higher.
Meanwhile, institutional sellers recognize the double failure and start shorting the stock. Once the price breaks below the Neckline (the Valley), the bullish structure of higher lows is completely broken. Long-position holders cut their losses, accelerating the sell-off. The trend has reversed.
Comparison: Double Top vs. Double Bottom
| Parameter | Double Top | Double Bottom |
|---|---|---|
| Visual Shape | Looks like the letter "M". | Looks like the letter "W". |
| Market Trend | Forms after an Uptrend. | Forms after a Downtrend. |
| Neckline Position | Drawn horizontally at the Valley low. | Drawn horizontally at the Peak high. |
| Trade Entry Signal | Close below Neckline (Short). | Close above Neckline (Long). |
| Target Calculation | Height of peaks to valley, projected down. | Height of valley to peak, projected up. |
How to Trade the Formations Step-by-Step
Many retail traders lose money trading these formations because they enter prematurely. They see a double top starting to drop from Peak 2 and short immediately. This is dangerous because the price can easily bounce at the neckline and resume the uptrend. Here is the correct way to trade these structures:
Step 1: Wait for Neckline Confirmation
Do not enter a trade until a candlestick closes completely outside the neckline. A close below the neckline in a Double Top or above the neckline in a Double Bottom is your confirmation that the pattern is active.
Step 2: Decide on Entry Style
- Breakout Entry: Enter immediately on the close of the breakout candle. This ensures you are in the trade, but you may have a larger stop loss if the breakout candle was very long.
- Retest Entry (Recommended): Wait for the price to pull back and touch the broken neckline. Look for confirmation wicks (rejections) and enter. This provides a tight stop loss and a much better risk-to-reward ratio.
Step 3: Place Your Stop Loss
For a Double Top, place your stop loss above the midpoint of the pattern or just above Peak 2. For a Double Bottom, place your stop loss below the midpoint or just below Trough 2. If the price returns past these points, the pattern is invalidated.
Step 4: Project the Target
Measure the vertical distance from the Neckline to the highest Peak (for Double Tops) or lowest Trough (for Double Bottoms). Project this exact distance from the breakout point. This is your mathematical take-profit target.
Pro Tips for High-Probability Trading
- Watch the Volume Divergence: The volume on Peak 2 should be noticeably lower than on Peak 1. This shows that the market is running out of buyers on the second attempt. High volume on the neckline breakout is a strong signal that institutional players are driving the new trend.
- Adam and Eve Variations: Sometimes the two peaks or troughs look different. An "Adam" peak is sharp and pointed (formed by a single candle wick reversal), while an "Eve" peak is rounded and consolidation-heavy. A mixed "Adam and Eve" double top is just as valid as a symmetrical one.
- Check Higher Timeframes: A double top on a 5-minute chart is weak. A double top that forms on a Daily chart at a historical major resistance line is an extremely high-probability trade. Always look for structural convergence.
Conclusion
Double Tops and Double Bottoms are classic reversal patterns because they reflect the fundamental behavior of market participants. By trading only after the neckline breakout, watching volume divergence, and using retests for optimal entry, you can safely navigate these major market turning points with a mathematical edge.
Educational & Regulatory Disclaimer
This publication is created strictly for educational and financial literacy purposes. InnocentInvestor is not a SEBI-registered investment advisor or research analyst. Stock market investments are subject to market risks; please consult a qualified financial planner before making investment decisions.
