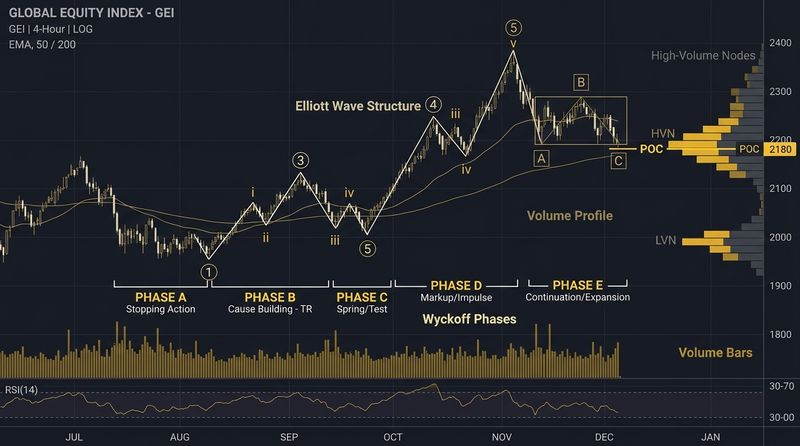
If you've ever stood on a beach, you know that the ocean doesn't advance in a single, continuous flow of water. Instead, it moves in waves. A wave crashes onto the sand, retreats, and then a larger wave follows, pushing the tide further up the shore. In the 1930s, an accountant named Ralph Nelson Elliott realized that the financial markets behave in the exact same way.
Elliott discovered that market prices do not move randomly; they move in repetitive cycles driven by the collective psychology of the participants. These cycles are painted on charts as specific geometric patterns which he termed "waves." Elliott Wave Theory is one of the most comprehensive frameworks for analyzing market cycles, helping traders determine where the market stands in the macro-trend and predict where it is headed next. Let's break down the basic principles, the core rules, and how to apply this theory to your trading.
The Basic Principle: The 5-3 Wave Cycle
According to Elliott, a complete market cycle consists of two primary phases: the Impulsive Phase and the Corrective Phase. Together, these form a basic 8-wave pattern:
- Impulse Waves (1, 2, 3, 4, 5): Five waves that push the price in the direction of the main trend.
- Corrective Waves (A, B, C): Three waves that move counter to the main trend, consolidating the gains.
Once a 5-wave impulse is complete, a 3-wave correction follows. This complete 8-wave cycle then becomes the first two waves of a larger degree wave (fractal nature). Like nesting Russian dolls, waves exist within waves, from 1-minute charts all the way up to multi-decade supercycles.
Anatomy of the 5-Wave Impulse
To count waves accurately, you must understand the psychological forces driving each segment of the impulse phase:
- Wave 1 (Accumulation): The initial move up. This is usually driven by "smart money" (institutions) who feel the asset is undervalued. The general public is still bearish, and news is still negative.
- Wave 2 (The Pullback): A sharp sell-off. Buyers who entered during Wave 1 take profits, and remaining bears short the market, convinced the downtrend is resuming. However, the price fails to make a new low.
- Wave 3 (The Participation): The longest and most powerful wave. The crowd realizes a new uptrend has begun. News turns positive, corporate earnings rise, and retail investors rush in. Volume is typically at its highest level here.
- Wave 4 (Profit Taking): A slow, choppy correction. Traders who bought early take profits, but buyers step in quickly, recognizing the market is still in a healthy uptrend.
- Wave 5 (The Climax): The final push up. Driven by retail FOMO (Fear Of Missing Out) and hype. Fundamentals are often overvalued, but sentiment is extremely bullish. This is where smart money quietly begins to exit.
The Three Cardinal Rules of Wave Formations
The biggest criticism of Elliott Wave Theory is that wave counting can be subjective. To bring structure and objectivity to the process, Elliott established three unbreakable rules for impulse waves. If a wave count violates any of these rules, the count is invalid, and you must start over:
The Unbreakable Rules:
- Rule 1: Wave 2 can never retrace more than 100% of Wave 1. (It cannot drop below the start of Wave 1).
- Rule 2: Wave 3 can never be the shortest of the three impulse waves (Waves 1, 3, and 5). It is usually the longest.
- Rule 3: Wave 4 can never enter the price territory of Wave 1. (The bottom of Wave 4 cannot overlap the top of Wave 1).
Corrective Waves: ABC Formations
Following the 5-wave impulse, the market enters a corrective phase. Corrective waves are categorized into three primary structural types:
1. Zig-Zag (5-3-5 Structure)
A sharp, steep correction against the main trend. Wave A consists of 5 sub-waves, Wave B of 3 sub-waves, and Wave C of 5 sub-waves. This is a very aggressive correction that quickly wipes out late-buyers.
2. Flat (3-3-5 Structure)
A sideways consolidation. Wave A has 3 sub-waves, Wave B has 3, and Wave C has 5. In a flat correction, Wave B will rise to near the top of the previous Wave 5, and Wave C will end near the bottom of Wave A, forming a horizontal channel.
3. Triangle (3-3-3-3-3 Structure)
A converging consolidation pattern labeled A-B-C-D-E. Triangles represent a balance of force, usually preceding the final thrust in the direction of the dominant trend (such as Wave 5).
Combining Elliott Wave with Fibonacci
Elliott Wave Theory gains its true power when paired with Fibonacci mathematics. The waves naturally project and retrace in precise Fibonacci ratios:
| Wave Segment | Standard Fibonacci Relationship | Application for Traders |
|---|---|---|
| Wave 2 | Retraces 50%, 61.8%, or 78.6% of Wave 1 | Look for long entries as Wave 2 nears the 61.8% golden pocket. |
| Wave 3 | Extends to 161.8% or 261.8% of Wave 1 | Use Fibonacci extensions to set profit targets for Wave 3 runs. |
| Wave 4 | Retraces 23.6%, 38.2%, or 50% of Wave 3 | Expect a shallow pullback, buying the 38.2% level to ride Wave 5. |
| Wave 5 | Equal to Wave 1, or 61.8% of the distance from Wave 1-3 | Watch for divergence on RSI and take profits near projected targets. |
How to Trade the Wave roadmap
While counting every sub-wave is difficult, you can focus on trading the highest-probability waves:
- Trading Wave 3: The most lucrative trade. Once you identify a clear Wave 1 breakout followed by a Wave 2 pullback that holds the 61.8% Fibonacci level, enter a long trade. Place your stop-loss just below the start of Wave 1. Target the 161.8% extension level.
- Trading Wave 5: After Wave 4 corrects and holds above the Wave 1 high, enter a long position, targeting the Wave 5 projection. Be cautious, as Wave 5 is speculative and prone to sudden reversals.
Limitations and Best Practices
To avoid getting lost in wave counts, keep these principles in mind:
- Stay Flexible: Wave counts are hypotheses, not certainties. If the price violates a rule, immediately discard your count and re-label your chart.
- Use Additional Indicators: Confirm wave ends with oscillator divergence. For example, during Wave 5, the price will make a new high, but the RSI will make a lower high (bearish divergence), confirming the trend is exhausted.
Conclusion
Elliott Wave Theory is a powerful lens for viewing market cycles. By understanding the waves of accumulation, participation, profit-taking, and speculation, you can position yourself on the right side of the macro-tide. Keep the three cardinal rules in mind, anchor your targets to Fibonacci extensions, and ride the natural waves of market psychology.
Educational & Regulatory Disclaimer
This publication is created strictly for educational and financial literacy purposes. InnocentInvestor is not a SEBI-registered investment advisor or research analyst. Stock market investments are subject to market risks; please consult a qualified financial planner before making investment decisions.
