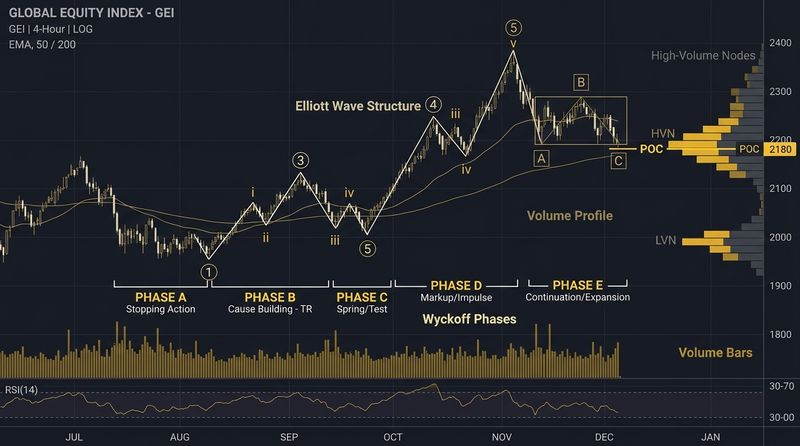
Ask a group of traders what they fear most, and they will likely give you the same answer: a flat, boring, sideways market. Most trading strategies—moving average crossovers, trend lines, momentum breakouts—rely on price trending in a clear direction. When a stock enters a range-bound, sideways phase, trending strategies get chopped to pieces by constant false breakouts and transaction fees.
However, the reality of financial markets is that **assets spend over 70% of their time in sideways, non-trending consolidations**. To turn these periods of flat price action into a reliable source of profit, professional traders utilize **Grid Trading**. By plotting a matrix of buy and sell orders at regular intervals above and below a reference price, grid trading turns market volatility into a money-making engine, buy-low and selling-high completely on autopilot. Let's explore how grid trading works, how to set up grid parameters, and how to manage the unique risks of this strategy.
What is Grid Trading?
Grid trading is a systematic, non-directional strategy that does not try to predict where the price is heading. Instead, it relies on a simple, timeless truth: **prices fluctuate**. Even in a flat market, the price moves up and down within a range.
A grid trader constructs a "grid" of buy and sell orders:
- **Buy orders** are placed at set intervals below the current price.
- **Sell orders** are placed at set intervals above the current price.
By repeating this process hundreds of times, the grid strategy accumulates micro-profits from every minor wave in price, without requiring you to time the market or sit in front of charts all day.
Designing the Grid: Core Parameters
To deploy a grid trading strategy (typically automated using a trading bot), you must define several parameters:
1. Lower and Upper Price Boundaries
This is the range in which your bot will operate. You must identify strong support (lower boundary) and strong resistance (upper boundary) levels on your chart. If the price breaks outside these boundaries, the bot will stop trading, and you will hold either 100% cash (above the range) or 100% of the asset (below the range).
2. Grid Density (Number of Grids)
This determines how many buy and sell levels are placed within your range.
- **Tight Grid (Many levels):** Triggers trades on tiny price movements, resulting in high trading activity. However, it requires a larger capital pool and means higher transaction fees.
- **Wide Grid (Few levels):** Triggers trades only on larger price swings. It is cheaper in terms of fees and requires less capital, but you will miss out on smaller fluctuations.
3. Arithmetic vs. Geometric Grid Intervals
How should the grid levels be spaced?
- **Arithmetic Grid:** Every grid level is separated by a fixed dollar amount (e.g., every $2.00). This is ideal for assets trading in a tight, narrow horizontal range.
- **Geometric Grid:** Every grid level is separated by a fixed percentage (e.g., every 1.5%). This is better suited for highly volatile assets or wider price ranges, ensuring consistent profit margins per trade.
| Grid Parameter | Setting Type | Best Suited For | Key Benefit |
|---|---|---|---|
| Arithmetic Interval | Fixed Dollar Spacing (e.g., $1.00, $2.00) | Stable Blue Chips, Commodities | Simple setup, max performance in tight ranges. |
| Geometric Interval | Fixed Percentage Spacing (e.g., 1%, 2%) | High Volatility, Crypto, Growth Stocks | Protects profit margin as price scales up. |
| Spot Grid | No leverage, buying physical asset | Long-term investments, index funds | No liquidation risk, extremely safe. |
| Futures Grid | Leveraged derivative contracts | Professional intraday setups | Allows short-grid plays, high capital efficiency. |
Step-by-Step Scenario of a Grid Bot in Action
Let's look at a concrete example of an arithmetic Spot Grid bot on a stock trading at $100:
- **Upper Limit:** $110 | **Lower Limit:** $90 | **Grid Steps:** 5 levels ($5.00 intervals at $90, $95, $100, $105, $110).
- At startup, the bot buys a base position and places buy limits at $95 and $90, and sell limits at $105 and $110.
- **Day 1:** Price drops to $94. The buy order at $95 is triggered. The bot immediately cancels that buy order and places a sell limit at $100.
- **Day 2:** Price recovers to $101. The sell order at $100 is triggered. The bot locks in a $5.00 profit, and places a new buy limit at $95.
As long as the price stays between $90 and $110, the bot will continue this cycle, converting volatility directly into cash flow.
Risk Management and the "Grid Trap"
While grid trading sounds like a guaranteed win, it has one major vulnerability: **the one-way breakout**.
- **Downside Breakout Trap:** If the price breaks below your lower limit ($90) and keeps crashing to $50, your bot will have triggered all buy orders on the way down. You are now holding a full position of a collapsing asset at an average cost of $100. This results in heavy floating paper losses.
- **Upside Breakout Trap:** If the price breaks above your upper limit ($110) and skyrockets to $150, your bot will have triggered all sell orders on the way up. You are now in 100% cash, having missed out on a massive trend.
Mitigating Grid Risks:
- **Use a Stop-Loss:** Always place a hard stop-loss just below your lower grid boundary. If the support breaks, the bot must sell all accumulated assets immediately to prevent capital destruction.
- **Select the Right Assets:** Never run grid trading on hype stocks, micro-caps, or companies with bankruptcy risks. Only run grids on assets that have a history of healthy mean-reversion, such as major index ETFs, blue-chip stocks, or stable commodities.
- **Avoid Over-leveraging:** If using futures grids, keep leverage low (2x-3x maximum). Sideways markets can expand suddenly, and high leverage will lead to margin calls.
Conclusion
Grid trading is the ultimate framework for extracting steady, automated profits from range-bound markets. By removing human emotion and market timing from the equation, it allows you to capitalize on the natural volatility of consolidations. Set clear range boundaries, implement a defensive stop-loss, and let automation turn market silence into portfolio progress.
Educational & Regulatory Disclaimer
This publication is created strictly for educational and financial literacy purposes. InnocentInvestor is not a SEBI-registered investment advisor or research analyst. Stock market investments are subject to market risks; please consult a qualified financial planner before making investment decisions.
