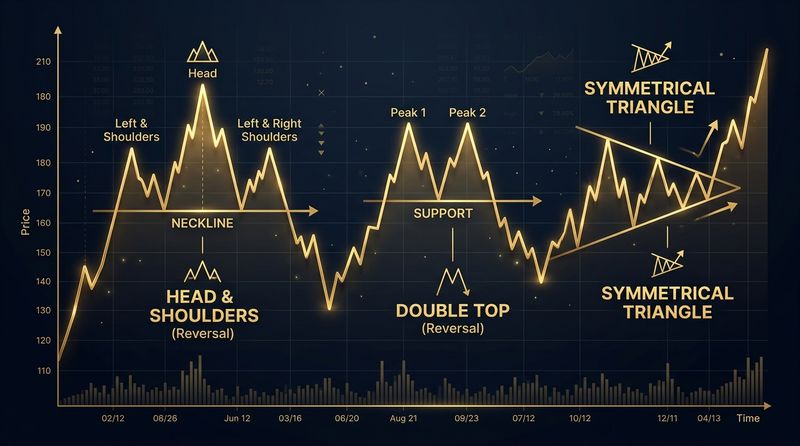
In the financial markets, trends are like freight trains: they possess massive momentum, and standing in front of them is a quick way to lose capital. However, even the strongest trends eventually run out of fuel. For a trader, spotting the exact turning point where an uptrend ends and a downtrend begins is the holy grail. While many patterns attempt to flag this transition, none do so with the historical reliability and structural clarity of the Head and Shoulders (H&S) pattern.
Recognized by technical analysts for over a century, the Head and Shoulders pattern is the ultimate visualization of market exhaustion. When fully understood, it acts as an early warning system, allowing investors to protect their long positions and active traders to profit from short-selling opportunities as the market structure breaks down.
Anatomy of the Head and Shoulders Pattern
A standard Head and Shoulders pattern is a bearish reversal pattern that forms at the peak of an uptrend. Its name is highly literal, describing a distinct shape resembling a head flanked by two shoulders. The pattern is comprised of four main structural components:
- The Left Shoulder: The market rises to a new high (forming a peak) and then pulls back to find temporary support. This is normal uptrend behavior.
- The Head: From the support level, the market rallies again, breaking above the previous peak to establish a higher high. However, this move is met with strong selling pressure, and the price declines back to the previous support area.
- The Right Shoulder: The market attempts one final rally. However, buying momentum has dried up. The price fails to reach the height of the Head and peaks at a level roughly equal to the Left Shoulder before reversing downward.
- The Neckline: A line drawn by connecting the support lows formed after the Left Shoulder and the Head. This acts as the critical line of defense for the bulls.
The Market Psychology: How the Bull Dies
To trade this pattern successfully, we must understand the shift in psychology occurring behind the scenes. Let's break down the mechanics of the market structure during its formation:
An uptrend is defined by a series of higher highs and higher lows. The Left Shoulder and Head represent the continuation of this uptrend. The first sign of trouble appears when the price pulls back from the Head. Instead of holding at a higher level, it drops all the way back to the support level of the left shoulder's low, indicating that sellers are growing stronger.
The real shift occurs at the Right Shoulder. In a healthy uptrend, buyers should easily push the price to a new high. The failure to even match the previous high (the Head) is a massive red flag. It proves that the bulls are exhausted. When the price turns down from the Right Shoulder and breaks below the Neckline, the market structure has officially flipped: the higher high structure is dead, replaced by lower highs and lower lows. The bears are now in control.
The Bullish Counterpart: The Inverse Head and Shoulders
While the standard Head and Shoulders pattern signals a bearish reversal, its mirror image—the Inverse Head and Shoulders—signals a bullish reversal at the bottom of a downtrend.
Instead of peaks, it consists of three troughs: a Left Shoulder trough, a lower Head trough, and a higher Right Shoulder trough. The breakout occurs when the price breaks above the resistance neckline, signaling that the downtrend has ended and a new bull market has begun.
Comparison: Bearish vs. Bullish Reversals
| Feature | Standard Head & Shoulders | Inverse Head & Shoulders |
|---|---|---|
| Market Trend Context | Forms at the peak of an Uptrend. | Forms at the bottom of a Downtrend. |
| Neckline Role | Acts as a support floor. | Acts as a resistance ceiling. |
| Trigger Event | Breakout below the neckline. | Breakout above the neckline. |
| Target Projection | Projected downward from the breakout. | Projected upward from the breakout. |
How to Trade the Head and Shoulders Pattern
Trading this pattern requires discipline. Chasing the market before the pattern is fully complete is a recipe for disaster. There are two primary entry methods:
Method 1: The Neckline Breakout (Aggressive Entry)
The breakout entry is the most common approach. The trade is triggered the moment a candlestick closes below the neckline.
Trade Execution: Enter a short position on the close of the breakout candle. Place your stop loss just above the high of the Right Shoulder. This keeps your risk defined while ensuring you do not miss a rapid downward move.
Method 2: The Retest entry (Conservative Entry)
Many breakouts are followed by a brief rally back to the broken neckline, as broken support converts into resistance.
Trade Execution: Do not enter on the breakout candle. Instead, wait for the price to pull back to the neckline. If the price retests the neckline and shows bearish rejection (long wicks on top), enter short. This method provides a much tighter stop loss and a superior risk-to-reward ratio, although you risk missing the trade entirely if the price crashes without a pullback.
Measuring Your Targets Scientifically
One of the greatest benefits of the Head and Shoulders pattern is that it provides a specific, mathematically projected price target. This takes the guesswork out of taking profits.
To calculate the target:
- Measure the vertical distance (in dollars or percentage) from the absolute peak of the Head to the Neckline.
- Subtract that same distance from the exact point where the price breaks the neckline.
- Set your take-profit target at this calculated level.
For example, if the Head is at $150 and the Neckline is at $120, the height is $30. If the breakout occurs at $120, your target would be $90 ($120 - $30).
Common Pitfalls and Pro Tips
- Never Front-Run the Neckline: Retail traders often try to predict the right shoulder and enter short before the neckline is broken. This is highly risky. Until the neckline breaks on a closing basis, the pattern does not exist, and the uptrend can easily resume.
- Watch the Volume: In a classic H&S pattern, volume should be highest during the formation of the Left Shoulder, lower during the Head, and lowest during the Right Shoulder. A breakout of the neckline accompanied by high volume is a strong confirmation of the trend reversal.
- Sloping Necklines: Necklines are rarely perfectly horizontal. They will often slope slightly upward or downward. An upward-sloping neckline represents a stronger market (bullish resilience), while a downward-sloping neckline indicates that sellers are already pushing the market down, making the breakout even more explosive.
Conclusion
The Head and Shoulders pattern remains a cornerstone of price action analysis because it is grounded in structural psychology. By waiting for the neckline to break, observing the volume, and utilizing the pullback entry method, you can trade trend reversals with high confidence and structured, mathematical risk management.
Educational & Regulatory Disclaimer
This publication is created strictly for educational and financial literacy purposes. InnocentInvestor is not a SEBI-registered investment advisor or research analyst. Stock market investments are subject to market risks; please consult a qualified financial planner before making investment decisions.
