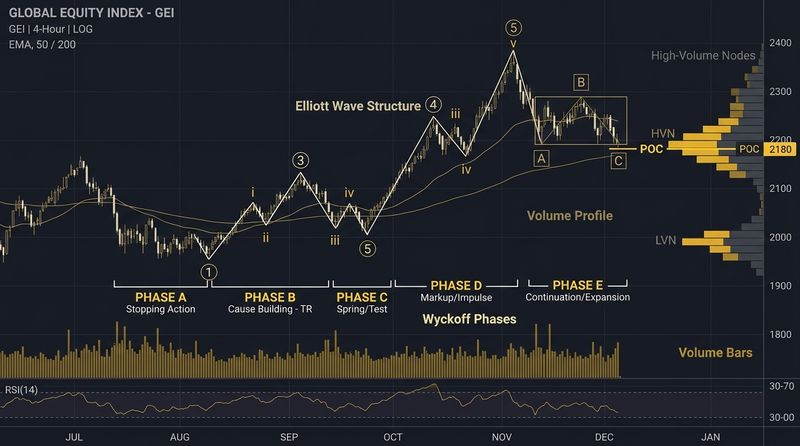
Have you ever tried to read a book while riding on a bumpy dirt road in a car? The constant shaking makes it almost impossible to focus on the words. In the financial markets, standard candlestick charts can feel exactly like that bumpy road. On a strong upward trend, a stock will frequently print red counter-trend candles. These minor price drops do not signify a trend reversal, but they generate massive emotional distress for retail traders, often tricking them into exiting a profitable trade way too early.
To eliminate this market noise and smooth out the visual representation of trends, Japanese traders developed Heikin Ashi candlesticks. Meaning "average bar" in Japanese, Heikin Ashi is a modified charting style that recalculates candles based on moving averages rather than raw open, high, low, and close prices. The result is a clean, visually harmonious chart where uptrends are painted in solid green and downtrends in solid red, allowing you to ride trends with peace of mind. Let's explore the mechanics, math, and strategies of this elegant charting style.
The Heikin Ashi Formula: Recalculating the Candles
Standard candlesticks represent raw, unedited data: the exact open, high, low, and close of a specific timeframe. In contrast, Heikin Ashi recalculates each value using averages of both the current candle and the previous candle. The formulas are:
Heikin Ashi Open (HA-Open) = [HA-Open(Previous) + HA-Close(Previous)] / 2
Heikin Ashi High (HA-High) = Maximum of (High, HA-Open, HA-Close)
Heikin Ashi Low (HA-Low) = Minimum of (Low, HA-Open, HA-Close)
By defining the HA-Open as the midpoint of the previous candle's body, Heikin Ashi candles are anchored to the past. This prevents the charts from showing gaps between candles, creating a continuous flow of price action.
Reading Heikin Ashi Signals
Because the calculations are smoothed, Heikin Ashi candlesticks are read differently than standard Japanese candles. You don't look for complex patterns like "three black crows" or "head and shoulders" on Heikin Ashi. Instead, you look for three simple structural signals:
- Strong Bullish Candles: Green candles with large bodies and no lower shadows (wicks). This indicates that buyers are in complete control. When you see consecutive flat-bottomed green candles, you must stay in your long position and avoid taking early profits.
- Strong Bearish Candles: Red candles with large bodies and no upper shadows (wicks). This indicates sellers are dominating. Consecutive flat-topped red candles tell you to remain in short positions or stay cash-heavy.
- Indecision / Reversal Candles: Candles with small bodies and long shadows on both the top and bottom. Similar to standard doji candles, these indicate that the trend is losing momentum. When these appear after a long series of strong trend candles, it is a warning that a correction or reversal is imminent.
| Candle Appearance | Market Signal | Trader Action |
|---|---|---|
| Green body, flat bottom (no lower wick) | Strong Bullish Momentum | Hold long positions, do not sell |
| Green body with a lower wick | Weakening Bullish Momentum | Watch for reversal, tighten stop-loss |
| Small body, long wicks on both sides | Indecision / Trend Exhaustion | Prepare to exit, wait for next directional signal |
| Red body with an upper wick | Weakening Bearish Momentum | Prepare for short exit, tighten stop-loss |
| Red body, flat top (no upper wick) | Strong Bearish Momentum | Hold short positions, stay cash-heavy |
Trading Strategies Using Heikin Ashi
Heikin Ashi is most effective when used as a filter alongside other technical tools. Here are two popular strategies:
1. The Trend-Rider Strategy
This strategy aims to catch the majority of a sustained medium-term trend.
- Entry: Wait for a trend reversal candle (small body, wicks on both sides) to appear. Following this, wait for two consecutive strong candles in the new direction (e.g., two green candles with no lower wicks). Enter the trade.
- Trailing Stop: Keep the trade open as long as the candles remain green and have flat bottoms.
- Exit: Close the trade the moment a candle prints with a lower wick, or when a red candle appears, securing your profits.
2. The Heikin Ashi + EMA Cross
Combine Heikin Ashi candles with a 50-period Exponential Moving Average (50 EMA) to filter out fakeouts in range-bound markets:
- Long Setup: Only buy if the price is above the 50 EMA AND you see consecutive flat-bottomed green Heikin Ashi candles.
- Short Setup: Only short if the price is below the 50 EMA AND you see consecutive flat-topped red Heikin Ashi candles.
Important Limitations of Heikin Ashi
Because Heikin Ashi averages price data, it is not suitable for all trading styles. Keep these warnings in mind:
- Not for Price Action Entries: Heikin Ashi candles do not show the actual current price of the asset. The last printed "close" on a Heikin Ashi candle is a mathematical calculation. For executing actual trades, you must always look at a standard candlestick chart or your broker's order interface to see the real bid/ask price.
- Lags Reversals: Because it averages historical data, Heikin Ashi will react slower to sharp, sudden reversals. If a stock crashes on sudden news, a Heikin Ashi chart will show a delay before painting a red candle, causing you to exit later than you would using a standard chart.
- Obscures Gaps: Heikin Ashi does not display overnight price gaps. If you trade options or volatile stocks overnight, you must use standard charts to monitor gaps.
Conclusion
Heikin Ashi is a powerful, visually clean tool that helps retail traders overcome the psychological temptation of exiting winning trades prematurely. By smoothing out minor counter-trend noise and emphasizing trend strength, it acts as a calming filter on market chaos. Use Heikin Ashi to stay aligned with the dominant trend, but always cross-reference with standard candlesticks for precise order execution.
Educational & Regulatory Disclaimer
This publication is created strictly for educational and financial literacy purposes. InnocentInvestor is not a SEBI-registered investment advisor or research analyst. Stock market investments are subject to market risks; please consult a qualified financial planner before making investment decisions.
