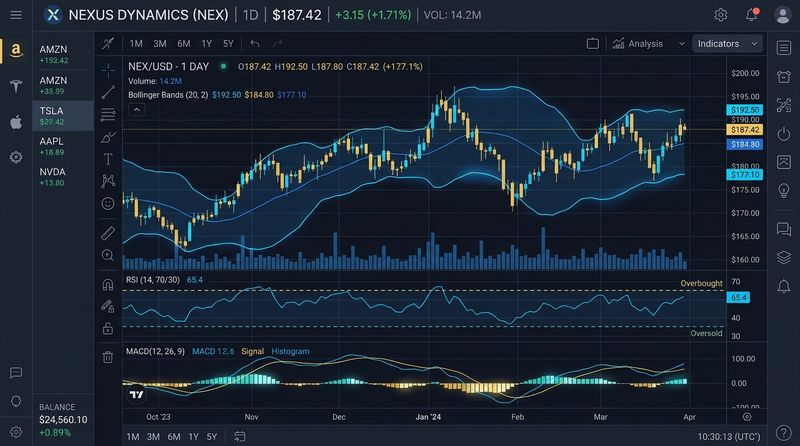
Have you ever wished you could open a stock chart and immediately understand the trend, momentum, support levels, and resistance zones in less than a second? For most technical analysts, this requires plotting multiple indicators—moving averages, support lines, and momentum oscillators—and attempting to synthesize the conflicting information. However, there is a Japanese charting system designed to provide this complete view in a single glance. It is called the Ichimoku Cloud.
Developed in the late 1930s by Goichi Hosoda, a Japanese journalist who wrote under the pen name "Ichimoku Sanjin," the indicator's official name is Ichimoku Kinko Hyo. Translated literally, it means "one-look equilibrium chart." Hosoda spent over 30 years refining the system before releasing it to the public in 1969. Today, it is a staple of Asian trading desks and remains one of the most comprehensive technical systems in the world.
The Five Core Components of Ichimoku
When you first load the Ichimoku Cloud on a chart, it can look intimidating. There are five lines running across the screen, some shifted forward and some shifted backward. Let's break them down simple terms:
1. Tenkan-sen (Conversion Line)
Calculated by averaging the highest high and lowest low over the past 9 periods. It is a fast-moving average that measures short-term momentum. Unlike standard moving averages, it uses highs and lows instead of closing prices, making it highly sensitive to price extremes.
2. Kijun-sen (Base Line)
Calculated by averaging the highest high and lowest low over the past 26 periods. It represents medium-term momentum and serves as a key trend-following anchor. If the price is above the Kijun-sen, the short-to-medium-term bias is bullish.
3. Senkou Span A (Leading Span A)
This is the average of the Tenkan-sen and Kijun-sen, plotted 26 periods into the future. It forms the first boundary of the Kumo (the Cloud).
4. Senkou Span B (Leading Span B)
This is the average of the highest high and lowest low over the past 52 periods, also plotted 26 periods into the future. It forms the second boundary of the Kumo.
5. Chikou Span (Lagging Span)
This is simply today's closing price plotted 26 periods backward in time. It is a filter that allows you to compare current price action with historical price action to confirm trend strength.
| Ichimoku Element | Lookback Period | Temporal Shift | Primary Function |
|---|---|---|---|
| Tenkan-sen | 9 periods | None (Current) | Short-term momentum tracking |
| Kijun-sen | 26 periods | None (Current) | Medium-term baseline & stop placement |
| Senkou Span A | Average of Tenkan & Kijun | Shifted 26 periods forward | Future support/resistance boundary |
| Senkou Span B | 52 periods | Shifted 26 periods forward | Future support/resistance boundary |
| Chikou Span | Current close | Shifted 26 periods backward | Trend validation / Filter |
The Kumo Cloud: Reading the Equilibrium
The space between Senkou Span A and Senkou Span B is shaded to form the Kumo (Cloud). This is the most famous element of the indicator. When the price is trading above the Cloud, the market is in a healthy uptrend. When the price is trading below the Cloud, the market is in a confirmed downtrend. If the price is inside the Cloud, it is a trendless, range-bound consolidation phase, and traders should stand aside.
Unlike standard horizontal lines, the Cloud represents a support and resistance zone that changes dynamically over time. The thickness of the Cloud indicates how strong the support or resistance is. A thick Cloud is difficult for prices to break through, whereas a thin Cloud indicates weak support/resistance that price can easily slice through.
The All-In-One Ichimoku Trading System
A professional Ichimoku trading system uses the five lines in unison to generate high-probability buy and sell signals. Here is a classic Bullish Trend-Following setup:
- Trend Filter: The price must break out and close above the Kumo Cloud.
- Momentum Signal: The fast Tenkan-sen must cross above the slower Kijun-sen (conversion-base line crossover).
- Validation Filter: The Chikou Span (lagging line) must be trading above the price action of 26 days ago.
- Cloud Color: The future Cloud (26 days ahead) should be green (Senkou Span A above Senkou Span B).
When all these conditions are met, traders enter long positions. Stop-losses are typically placed just below the Kijun-sen or the bottom of the Kumo Cloud, and the trade is ridden until the price closes back below the Kijun-sen.
Risk Management and Limitations
The Ichimoku Cloud is highly effective but has two key limitations:
- Range-bound Markets: Just like moving averages, the Ichimoku Cloud fails when prices are flat. The lines will tangle together, and the price will repeatedly cross back and forth through the Cloud, generating false signals.
- Visual Noise: The indicator requires significant chart space. Clean execution requires filtering out unnecessary information and training your eyes to focus on the price relative to the Cloud first, before reviewing crossovers.
Practical Action Steps for Traders
- Practice the "One-Look" rule: Load a chart. Spend exactly one second looking at it. Is the price above the Cloud? If yes, look for buy setups. If no, look for short setups or move to the next stock.
- Start with standard settings: Stick to the default settings of (9, 26, 52). These are calibrated for weekly and daily charts, representing traditional business weeks in Goichi Hosoda's time.
- Wait for the breakout close: Never enter a trade as the price is entering the Cloud. Wait for a clean daily close on the other side of the Cloud boundary for entry.
Conclusion
The Ichimoku Kinko Hyo is a comprehensive technical charting system that provides trend, momentum, support, and resistance data on a single screen. By mastering the Kumo Cloud boundaries, verifying setups with the Conversion and Base lines, and confirming signals with the Lagging Span, you can identify strong market trends with high confidence. Combine Ichimoku with proper stop-loss parameters and volume validation to complete your trading system.
Educational & Regulatory Disclaimer
This publication is created strictly for educational and financial literacy purposes. InnocentInvestor is not a SEBI-registered investment advisor or research analyst. Stock market investments are subject to market risks; please consult a qualified financial planner before making investment decisions.
