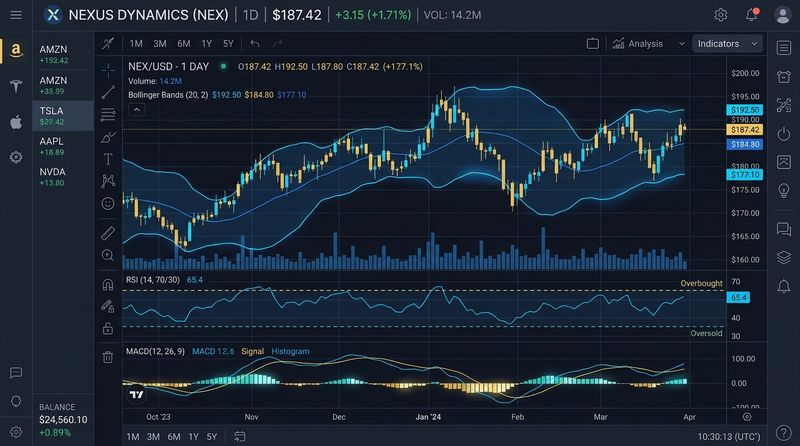
Have you ever watched a flock of birds flying in formation? Sometimes, individual birds drift apart, spreading out across the sky. But inevitably, they converge back together, maintaining their unified trajectory. In the stock market, prices behave in a similar way. Short-term price movements constantly pull away from long-term trends before snapping back. The Moving Average Convergence Divergence (MACD) is a tool designed to measure this exact behavior.
Created by Gerald Appel in the late 1970s, the MACD is a multi-layered indicator that combines trend-following properties with momentum tracking. It is a lagging indicator that acts like a dashboard speedometer, showing you how fast a stock is accelerating in a particular direction. If you want to know whether a market trend is gaining momentum or preparing to stall, the MACD is one of the most reliable tools available.
The Three Components of the MACD
Unlike simple oscillators that display a single squiggly line, the MACD is composed of three separate elements that work together on your chart:
1. The MACD Line
The MACD line is the heart of the indicator. It represents the distance between a short-term trend and a medium-term trend. By default, it is calculated by subtracting a 26-period Exponential Moving Average (EMA) from a 12-period EMA:
When the 12-period EMA is higher than the 26-period EMA, the MACD line is positive. When the 12-period EMA is lower, the MACD line is negative. The further the two moving averages drift apart, the higher the MACD line climbs, showing that momentum is accelerating.
2. The Signal Line
The Signal Line is a smoothed version of the MACD line itself. It is a 9-period EMA of the MACD line. Because it represents an average of the MACD's own values, it moves slower. It acts as a trigger line, highlighting when the MACD's speed is accelerating or decelerating relative to its recent average.
3. The MACD Histogram
The histogram is the set of vertical bars plotted around the zero center line. It visually represents the distance between the MACD Line and the Signal Line:
If the MACD line is above the Signal line, the histogram is positive (plotted above the zero line). If the MACD line drops below the Signal line, the histogram is negative. The height of the bars shows you how fast the gap between the two lines is expanding or contracting.
Core Trading Strategies Using MACD
Professional traders utilize the MACD in three primary ways to identify high-probability setups:
1. The Signal Line Crossover
This is the most common MACD strategy. A crossover occurs when the MACD line crosses the Signal line:
- Bullish Crossover: The MACD line crosses above the Signal line. This indicates that momentum is turning positive. It is a traditional buy signal, especially when the crossover occurs below the zero line.
- Bearish Crossover: The MACD line crosses below the Signal line. This indicates that momentum is turning negative. It is a traditional sell or exit signal, particularly when it occurs high above the zero line.
2. The Centerline (Zero Line) Crossover
A centerline crossover occurs when the MACD line moves from positive to negative, or vice versa. When the MACD line crosses above the zero line, it means the 12-day EMA has crossed above the 26-day EMA (a classic moving average crossover). This confirms that a medium-term uptrend has officially begun. Conversely, crossing below zero indicates a confirmed downtrend.
3. MACD Divergence
Just like the RSI, divergence on the MACD is a powerful reversal warning. A bullish divergence forms when a stock price falls to a lower low, but the MACD line holds a higher low. This shows that even though prices are dropping, the velocity of the sell-off is weakening, warning of a potential trend reversal.
| MACD Signal | Trigger Mechanism | Trend Context | Action Bias |
|---|---|---|---|
| Bullish Line Crossover | MACD line crosses above Signal Line | Early momentum acceleration | Potential Buy Entry |
| Bullish Zero Crossover | MACD line crosses above Zero Line | Confirmed medium-term uptrend | Trend Confirmation (Buy) |
| Bearish Line Crossover | MACD line crosses below Signal Line | Early exhaustion, momentum slowing | Potential Sell/Exit |
| Bearish Zero Crossover | MACD line crosses below Zero Line | Confirmed medium-term downtrend | Trend Confirmation (Sell) |
Limitations and Whipsaws
The MACD is an exceptional tool, but it has one primary weakness: sideways markets. Because the MACD is built on moving averages, it thrives in trending markets but fails in range-bound phases. When a stock price moves sideways, the EMAs will flatten out out and compress. The MACD line will repeatedly cross the Signal line back and forth, generating a series of false signals, or "whipsaws."
To mitigate this risk, never trade the MACD in isolation. Combine it with support and resistance levels, chart patterns, or volume analysis. For instance, only take a bullish MACD crossover if the price is bouncing off a significant support level, or if the stock is breaking out of a consolidation pattern on high volume.
Practical Action Steps for Traders
- Analyze the weekly timeframe: For long-term equity investing, analyze the MACD on a weekly chart. Weekly crossovers are highly reliable and filter out the daily noise of the market.
- Watch the histogram slope: When the histogram bars start shrinking back toward the zero line (even if they are still positive), it is an early warning that the current push is losing steam.
- Align with a trend indicator: Always verify the market trend with a 200-day Simple Moving Average. Look to take long trades when the price is above the 200 SMA and short trades when it is below.
Conclusion
The Moving Average Convergence Divergence indicator is a versatile tool that combines the benefits of trend-following moving averages with momentum oscillators. By understanding how the MACD line, Signal line, and histogram interact, you can better time your market entries, recognize early signs of trend exhaustion, and avoid trading against strong market momentum. Remember to combine it with solid support/resistance levels and maintain disciplined risk management to protect your capital.
Educational & Regulatory Disclaimer
This publication is created strictly for educational and financial literacy purposes. InnocentInvestor is not a SEBI-registered investment advisor or research analyst. Stock market investments are subject to market risks; please consult a qualified financial planner before making investment decisions.
