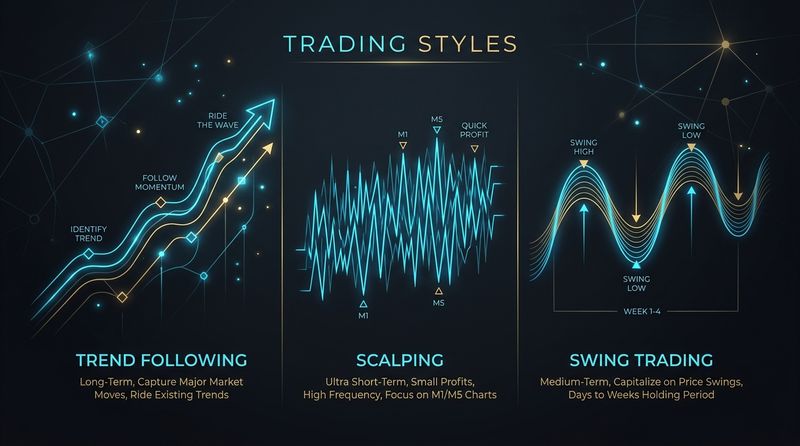
If you take a thick rubber band and pull it apart with your fingers, you feel resistance build up. The further you stretch it, the harder it pulls back. The moment you let go, it violently snaps back to its original shape. In the world of finance, stock prices often behave like that rubber band. No matter how high they soar on euphoria or how deep they plunge on panic, they are tethered to an underlying baseline. Mean Reversion is a trading style built entirely on this principle: the belief that asset prices and historical returns eventually tend to revert back to their long-term average or mean.
While trend followers try to catch major momentum waves, mean reversion traders do the opposite. They look for situations where the market has overreacted—stretching the rubber band to its absolute limits—and place trades betting on a snapback. It is a highly analytical, statistical approach to trading that requires patience, a strong stomach, and a deep understanding of probability. Let's break down how it works, the core tools used, and the hidden dangers of trying to catch falling knives.
The Philosophy: Spotting Market Inefficiencies
The financial markets are driven by human beings, which means they are driven by fear and greed. During a panic, investors sell everything, pushing solid companies down to irrationally cheap levels. During a mania, buyers chase hot stocks, driving their prices to unsustainable heights. Mean reversion traders view these extremes as temporary market inefficiencies.
Unlike long-term value investors who buy cheap companies and hold them for years, mean reversion traders operate on shorter timeframes (days or weeks). They aren't trying to build a business partnership with the company. They simply want to exploit the rapid price correction that occurs when the market realizes it went too far. It is a game of statistics: you wait for the price to deviate significantly from its historical norm, enter a position, and exit as soon as the price returns to its average.
Essential Tools for Mean Reversion
To identify when a stock is stretched to its limit, traders rely on specific technical indicators designed to measure price deviations and momentum exhaustion:
1. Relative Strength Index (RSI)
The RSI is a momentum oscillator that measures the speed and change of price movements on a scale from 0 to 100. By default, it uses a 14-period lookback:
- Oversold (RSI below 30): Indicates that the asset has experienced heavy selling pressure and is potentially undervalued in the short term. Mean reversion traders look for buying opportunities here.
- Overbought (RSI above 70): Indicates that buying momentum has been extremely aggressive, and the price is vulnerable to a pullback. Traders look to sell or short-sell here.
2. Bollinger Bands
Developed by John Bollinger, this indicator consists of three lines plotted on a price chart:
- A middle line, which is a 20-period Simple Moving Average (SMA).
- An upper band, placed 2 standard deviations above the middle line.
- A lower band, placed 2 standard deviations below the middle line.
Standard deviation is a statistical measure of volatility. According to normal distribution principles, roughly 95% of price action should occur within the Bollinger Bands. When price breaks out of the upper band or lower band, it represents a rare statistical deviation (the rubber band is fully stretched). A mean reversion trader will buy when price touches or dips below the lower band, targeting a return to the middle 20 SMA.
3. Moving Average Pullback (e.g., 20 EMA or 50 SMA)
Even in a strong uptrend, prices rarely move in a straight line. They move in waves—surging upward, then pulling back to rest at their moving average. Mean reversion traders use these pullbacks to enter strong stocks at a "fair price." If a stock in a confirmed uptrend pulls back to its 20-day EMA, it is often a low-risk spot to buy, expecting the price to bounce back toward its recent highs.
Statistical Arbitrage and Pairs Trading
At the institutional level, mean reversion is executed through a sophisticated strategy called Statistical Arbitrage, often in the form of Pairs Trading. This technique involves finding two historically correlated assets—such as Coca-Cola and Pepsi, or ICICI Bank and HDFC Bank.
When the price relationship between these two stocks diverges beyond a statistically normal threshold (e.g., one stock surges while the other lags for no fundamental reason), the trader will simultaneously:
- Short-sell the overperforming stock.
- Buy the underperforming stock.
The trader is not betting on the direction of the market. They are betting that the historical correlation between the two stocks will eventually reassert itself, causing the spread to close. Once the relationship returns to the mean, both positions are closed for a profit.
Mean Reversion vs. Trend Following: A Tactical Contrast
To help you understand the tradeoffs, here is how mean reversion contrasts with trend following:
| Parameter | Mean Reversion | Trend Following |
|---|---|---|
| Execution Concept | Buy panic, sell euphoria. Go against the current crowd. | Buy strength, sell weakness. Ride with the crowd. |
| Win Rate | High (60% to 75%). Correcting pullbacks occur frequently. | Low (35% to 45%). Major trends are relatively rare. |
| Risk-Reward Profile | Asymmetrical (high risk for small, frequent gains). | Favorable (small risk for large, infrequent gains). |
| Ideal Market Phase | Sideways, range-bound, consolidated markets. | Strong, persistent trending markets. |
The Danger: When the Rubber Band Snaps
The biggest risk in mean reversion trading is famously summarized by economist John Maynard Keynes: "The market can remain irrational longer than you can remain solvent." When you buy an oversold stock, you are standing in front of a freight train. You assume the stock will stop falling and bounce. But what if it doesn't?
Sometimes, a stock is cheap for a reason. If a company is facing accounting fraud, bankruptcy, or structural industry decline, its price will continue to fall, and the "mean" will shift downward. This is the classic value trap. If you try to double-down on your position as it falls (averaging down), a single catastrophic trade can wipe out months of small, consistent wins. In mean reversion, when the rubber band snaps, it does so with devastating consequences.
Practical Risk Management Rules
- Never trade without a hard stop-loss: If you buy a stock on an RSI oversold bounce, and it breaks below key support levels, you must exit immediately. Do not hold and hope.
- Focus on high-quality, liquid stocks: Mean reversion works best on large-cap, highly liquid stocks (e.g., Nifty 50 constituents). These stocks have institutional backing, making a permanent collapse to zero highly unlikely. Avoid penny stocks, as they can stay oversold indefinitely.
- Verify with volume and candle confirmations: Don't just buy the moment the RSI hits 29. Wait for the price to show signs of stabilizing, such as a bullish hammer candlestick pattern on high volume, indicating that buyers are stepping in.
- Keep targets modest: Exit your trade when the price reaches the 20-day SMA or the middle Bollinger Band. Don't get greedy hoping for a new bull run; the goal is to capture the reversion, not the trend.
Conclusion
Mean reversion trading is a highly effective, mathematically sound trading style that allows you to profit from the emotional swings of the market. By buying when fear is high and selling when greed takes over, you act as a liquidity provider to the market, helping prices stabilize back to their fair value. However, it is a high-wire act. Without strict discipline, an ironclad stop-loss, and a refusal to average down on failing assets, a mean reversion trader can easily fall victim to the market's momentum. Master the math, manage the downside, and let the law of averages work in your favor.
Educational & Regulatory Disclaimer
This publication is created strictly for educational and financial literacy purposes. InnocentInvestor is not a SEBI-registered investment advisor or research analyst. Stock market investments are subject to market risks; please consult a qualified financial planner before making investment decisions.
