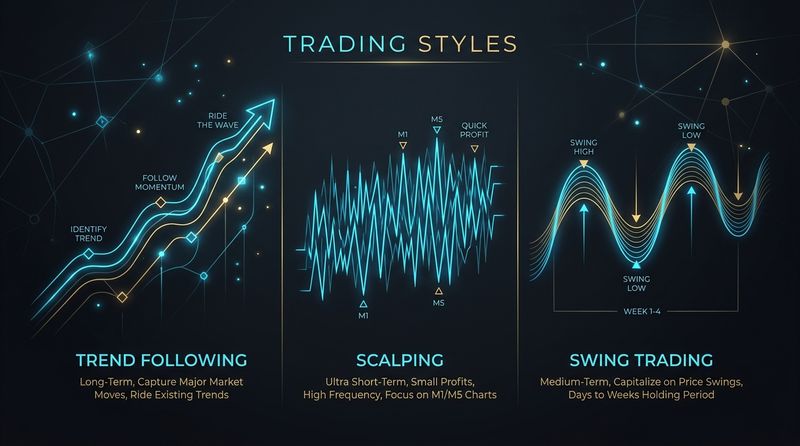
In physics, Sir Isaac Newton’s first law of motion states that an object in motion tends to stay in motion in the same direction unless acted upon by an external force. In the financial markets, stock prices often display the exact same physical property. When a stock builds a powerful head of steam, it tends to keep rising, defying traditional valuation models and analyst targets. Momentum Trading is a style built entirely on this phenomenon—identifying the fastest-moving stocks in the market, buying them as their trend accelerates, and riding them until the momentum begins to decay.
Momentum trading is the ultimate expression of active equity speculation. While value investors spend their time reading balance sheets looking for cheap, unloved companies, momentum traders do the exact opposite. They seek out the most popular, high-growth stocks that are making new 52-week or all-time highs. They are happy to pay what seems like an expensive price today because they expect price momentum to push it even higher tomorrow. Let's break down the mechanics of momentum, how to measure it, and how to survive the inevitable day the music stops.
The Core Philosophy: Strength Begets Strength
The philosophical foundation of momentum trading is simple: **winners tend to keep winning, while losers tend to keep losing**. In a bull market, institutional buying concentrates in a handful of high-growth companies that are executing on earnings or participating in hot economic themes. This concentration of buying power creates a self-reinforcing feedback loop. As the price rises, it attracts more technical buyers, media attention, and algorithmic trading models, which drives the price even higher.
Momentum traders do not buy stocks because they are cheap. In fact, if a stock is cheap or trading at multi-year lows, momentum traders view it as a toxic asset. They want stocks with high velocity. They aim to capture the vertical, parabolic phase of a stock's run—often referred to as the **trend acceleration** phase—where the price makes massive gains in a short period.
Key Concept: Relative Strength (RS) vs. RSI
A common point of confusion for beginners is the difference between Relative Strength (RS) and the Relative Strength Index (RSI). They are completely different concepts:
- RSI (Relative Strength Index): A technical momentum oscillator that measures whether a single stock is overbought or oversold on a scale of 0 to 100 based on its recent price history.
- Relative Strength (RS): A comparative metric that measures how a stock is performing *relative to a benchmark index* (such as the Nifty 50). If the Nifty 50 falls by 2% during a market correction, but a specific stock remains flat or rises by 1%, that stock has high Relative Strength. When the market recovers and turns bullish, stocks with the highest Relative Strength are almost always the ones that surge the fastest.
Momentum traders scan the market daily to find stocks showing high Relative Strength. They look for companies that refuse to fall when the broader market is in a correction, as this indicates strong institutional accumulation is taking place behind the scenes.
The Volatility Contraction Pattern (VCP)
Popularized by U.S. investing champion Mark Minervini, the Volatility Contraction Pattern (VCP) is a classic technical setup used by momentum traders to time entries in high-velocity stocks.
A VCP forms when a stock in a strong Stage 2 uptrend takes a breather. During this consolidation, the price swings become smaller and tighter from left to right (e.g., first pullback is 25%, second pullback is 12%, third pullback is 5%). This contraction in volatility indicates that sellers are disappearing and buyers are absorbing all available shares. Once the price consolidates to a very tight pivot point, a breakout on high volume triggers the trade, signaling that the stock is ready to resume its rapid upward momentum.
Momentum Trading vs. Value Investing
To help you understand the contrast in mindsets, here is a breakdown of how momentum trading compares to value investing:
| Parameter | Momentum Trading | Value Investing |
|---|---|---|
| Stock Selection Bias | Strong, high-growth stocks making new all-time highs. | Undervalued, cheap stocks trading at a discount. |
| Key Indicators | Relative Strength, price breakouts, volume spikes, moving average expansion. | P/E ratio, Price-to-Book, debt-to-equity, free cash flow yield. |
| Holding Horizon | Short to Medium term (weeks to months). | Long term (years to decades). |
| Primary Risk | Violent momentum reversals and parabolic blow-off tops. | Value traps (companies that stay cheap permanently). |
The Danger: Parabolic Tops and the Liquidity Rush
While momentum trading is incredibly lucrative during a strong bull market, it carries a high level of risk. When a stock goes parabolic (rising almost vertically on extreme retail euphoria), it becomes a game of "musical chairs." Everyone knows the price is far higher than its fair value, but they buy anyway, hoping to sell it to someone else at a higher price.
When the momentum finally slows and the price begins to drop, panic sets in. Because momentum stocks are highly crowded trades, everyone tries to sell at the same time. This creates a liquidity void, causing the stock to crash violently—often hitting consecutive lower circuits where you cannot sell your shares. To survive a momentum reversal:
- Never chase extended stocks: If a stock has surged 40-50% in a couple of weeks without forming a consolidation base or flag, do not buy. The risk-to-reward ratio is heavily stacked against you.
- Sell into strength (Trim positions): When a stock goes vertical and stretches 30% or more above its 20-day EMA, it is often wise to sell a portion of your position to lock in gains rather than waiting for your trailing stop to trigger.
- Use strict trailing stops: Protect your open profits. As the price rises, raise your stop-loss behind it, using indicators like the 10-day EMA or the Average True Range (ATR).
Conclusion
Momentum trading is a high-octane trading style that aligns your portfolio with the strongest, fastest-moving engines in the stock market. By focusing on Relative Strength, buying clean volume breakouts from tight patterns like VCPs, and refusing to buy cheap stocks, you can compound your capital at a rapid rate during bull markets. However, it requires absolute discipline, zero emotional attachment, and the humility to exit the trade the moment the momentum fades. Ride the trend, watch the volume, and make sure you exit before the music stops.
Educational & Regulatory Disclaimer
This publication is created strictly for educational and financial literacy purposes. InnocentInvestor is not a SEBI-registered investment advisor or research analyst. Stock market investments are subject to market risks; please consult a qualified financial planner before making investment decisions.
