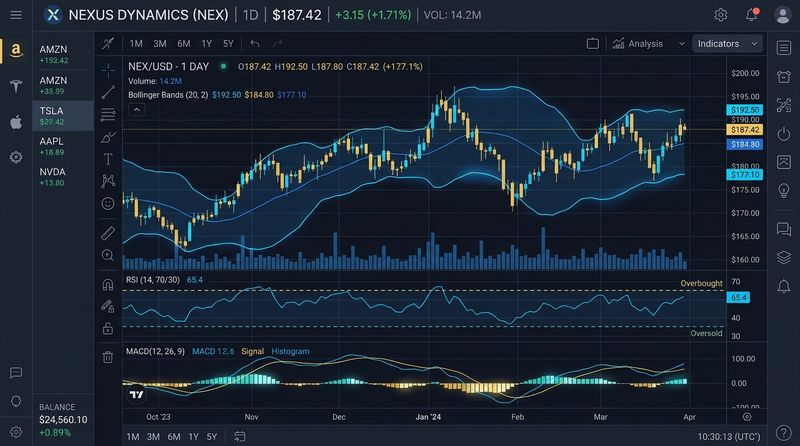
Imagine standing on the shore of a vast ocean, trying to track the movement of the tide. If you look at every individual wave crashing against the sand, the water will appear chaotic, rising and falling randomly. But if you take a step back and measure the average waterline over several hours, the underlying tide becomes obvious. In the financial markets, daily price fluctuations are the waves, and the long-term trend is the tide. Moving Averages are the technical tools designed to filter out the noise of those waves so you can trade the tide.
Moving averages are the foundation of trend-following systems. They take a series of past data points, average them together, and plot them as a smooth line on your price chart. While they do not predict the future, they tell you exactly what the market is doing in the present. By smoothing out short-term price spikes, moving averages make it easy to identify trend direction and potential support or resistance levels.
SMA vs. EMA: Understanding the Calculation
There are two primary types of moving averages that traders use: the Simple Moving Average (SMA) and the Exponential Moving Average (EMA). The core difference lies in how they weight past data points.
1. Simple Moving Average (SMA)
The SMA is the most basic average. It calculates the average price of a stock over a specific number of periods by giving equal weight to all days in the lookback period. The formula for a 5-day SMA is:
Because every day is weighted equally, a sharp price movement that happened five days ago has the same impact on the line as today's price action. This makes the SMA slower to react but less prone to false signals.
2. Exponential Moving Average (EMA)
The EMA is a more responsive calculation. It applies a multiplier that assigns greater weight to the most recent prices. The formula uses a smoothing factor, ensuring that today's price action has a larger impact on the indicator's direction than price action from a week ago.
Because it prioritizes recent data, the EMA turns faster than the SMA. This allows traders to enter trends earlier, but it also increases the risk of being caught in false breakouts (whipsaws) during volatile periods.
| Feature | Simple Moving Average (SMA) | Exponential Moving Average (EMA) |
|---|---|---|
| Data Weighting | Equal weight for all periods | More weight on recent price data |
| Reaction Speed | Slow (lagging) | Fast (reactive) |
| Primary Use Case | Long-term trend and institutional support | Short-term entries and swing trading |
| False Signal Risk | Low (filters noise effectively) | High (susceptible to whipsaws) |
Popular Moving Average Periods
Traders customize their moving averages based on their trading horizon. The most common periods include:
- 9 or 20 EMA: Used by short-term momentum and swing traders. These averages hug the price closely, identifying fast-moving trends.
- 50 SMA / EMA: The standard medium-term trend indicator. It represents the average price over a couple of months of trading and is widely monitored by mutual funds.
- 200 SMA: The ultimate long-term trend indicator. It represents approximately one year of trading history. Major institutions use the 200 SMA to distinguish bull markets from bear markets. When a stock is trading above its 200 SMA, it is generally considered to be in a healthy uptrend.
The Double Crossover System: Golden Cross and Death Cross
One of the most popular trend-following systems involves combining a short-term moving average with a long-term moving average. A signal is generated when the two lines cross:
1. The Golden Cross
A Golden Cross occurs when a short-term moving average (typically the 50 SMA) crosses above a long-term moving average (typically the 200 SMA). This indicates that near-term buying momentum is accelerating relative to the yearly average. Historically, the Golden Cross has signaled the early stages of major bull markets.
2. The Death Cross
A Death Cross occurs when the 50 SMA crosses below the 200 SMA. This indicates that short-term momentum is breaking down. It is a major warning signal of an impending bear market, prompting investors to reduce their equity allocations or hedge their portfolios.
Using Moving Averages as Dynamic Support and Resistance
In a healthy uptrend, a moving average does not just track the trend; it often acts as a floor for the price. When a stock pulls back during an uptrend, it will frequently bounce off its 50 EMA or 200 SMA. This is because large institutional buyers place buy orders near these key averages, creating a dynamic support level.
Conversely, in a downtrend, a moving average acts as a ceiling. Every time the price rally approaches the 50 SMA, sellers step in and push the price back down, establishing a dynamic resistance level.
Practical Implementation and Risk Management
While moving averages are invaluable, they are lagging indicators. Because they are based on past data, they will always tell you that a trend has turned after it has already started. This is the price you pay for confirmation. In range-bound, sideways markets, moving averages will flatten out and generate numerous false signals. To manage this risk:
- Look for slope: Do not buy a crossover if the moving averages are flat. A strong signal requires both moving averages to be sloping upward.
- Add a filter: Use volume analysis. A breakout above a key moving average is much more reliable if it occurs on high volume.
- Always use stop-losses: Never assume a moving average will hold. Set a protective stop-loss below the moving average to exit the trade if the trend fails.
Step-by-Step Action Plan
- Add the 50 SMA and 200 SMA to your charts. Review the historical performance of your favorite stocks and see how they reacted to these lines.
- Compare SMA and EMA behaviors. Plot a 20 SMA and a 20 EMA together on a chart to observe how the EMA reacts faster to sudden price shifts.
- Avoid trading during compression phases. When the 50 and 200 SMAs are tangled together and crossing repeatedly, step aside and wait for a clear trend to emerge.
Conclusion
Simple and Exponential Moving Averages are essential tools for any investor looking to build a disciplined, trend-following system. Whether you are using them to determine market direction, trade crossovers like the Golden Cross, or identify dynamic support and resistance levels, these averages help remove emotional bias from your trading. Combine them with proper risk management and trend validation to build a resilient trading strategy.
Educational & Regulatory Disclaimer
This publication is created strictly for educational and financial literacy purposes. InnocentInvestor is not a SEBI-registered investment advisor or research analyst. Stock market investments are subject to market risks; please consult a qualified financial planner before making investment decisions.
