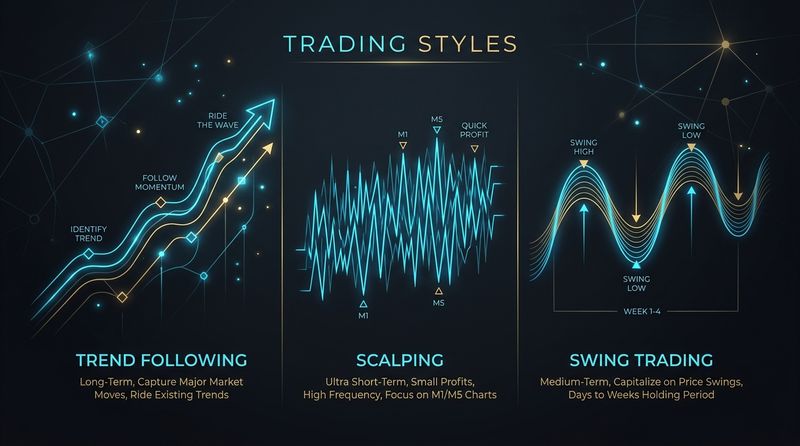
Imagine board a cross-country passenger train. You aren't concerned with the train's speed minute-by-minute, nor do you care if it stops briefly at small stations along the way. You have studied the route, verified the engine's reliability, and planned your journey to the final station hundreds of kilometers away. In the stock market, Position Trading is the equivalent of that long-distance rail journey. Position traders hold stocks for months or even years, ignoring short-term daily volatility and minor corrections to capture massive, long-term trends.
Position trading sits directly on the boundary line between active trading and long-term investing. It is a highly sophisticated approach that merges the analytical depth of **Fundamental Analysis** (to choose the right business) with the structural discipline of **Technical Analysis** (to time entries and manage risks). If you want to ride major secular bull runs in high-growth companies without the stress of daily market fluctuations, position trading is your ultimate roadmap. Let's explore how it works, the core concepts of sector rotation, and how to execute it systematically.
The Core Philosophy: Marriage of Fundamentals and Charts
Traditional buy-and-hold value investors buy a stock because it is undervalued relative to its assets and earnings. They are willing to wait years for the market to realize its value, even if the stock chart is in a structural downtrend. Day and swing traders do the opposite: they buy charts, ignoring what the company actually does, looking only for short-term price momentum.
A position trader combines the best of both worlds. Their philosophy is simple: **fundamental analysis tells you WHAT to buy, while technical analysis tells you WHEN to buy and WHEN to sell**. They look for high-quality growth businesses with strong macroeconomic tailwinds (fundamental catalyst) that are breaking out of massive consolidation bases on their weekly charts (technical trigger). Once they enter a position, they ignore the daily market noise, exiting only when the macro story changes or the long-term trend on the chart breaks down.
Sector Rotation: Following the Smart Money
A core pillar of position trading is understanding Sector Rotation. The stock market is not a single entity; it is a collection of different sectors (Banking, Information Technology, Pharmaceuticals, Auto, Infrastructure, FMCG). Institutional capital (mutual funds, insurance companies, foreign institutional investors) constantly rotates between these sectors based on the stage of the economic cycle.
For instance, when the economy is beginning to recover, institutions pump money into banking, infrastructure, and metal stocks. When the economy is slowing down or entering a defensive phase, they move capital into stable, defensive sectors like FMCG and Pharmaceuticals. A position trader watches these institutional flows. By aligning their portfolio with the sectors that are experiencing heavy institutional inflows, they ensure they are riding the strongest waves in the market.
The Four Stages of Stock Trends (Stan Weinstein Analysis)
Position traders use weekly charts to analyze the long-term lifecycle of a stock. Stan Weinstein's classic Stage Analysis outlines four distinct phases of a stock's trend:
- Stage 1: The Accumulation Phase (Consolidation): The stock moves sideways in a range, showing low volatility. Smart money is quietly buying shares, but the general public is ignoring the stock. The 30-week Moving Average is flat.
- Stage 2: The Advancing Phase (Uptrend): The stock breaks out above Stage 1 resistance on high volume. The price begins a sustained march upward, consistently staying above a rising 30-week Moving Average. This is the stage where position traders buy and hold.
- Stage 3: The Distribution Phase (Top): The uptrend stalls. The price swings wildly back and forth, and the 30-week Moving Average flattens out. Smart money is selling shares to retail buyers who are chasing the news.
- Stage 4: The Declining Phase (Downtrend): The price breaks below the Stage 3 support line. The stock begins a long, painful slide downward, trading below a falling 30-week Moving Average. Position traders stay away or short the stock during this phase.
Swing Trading vs. Position Trading vs. Value Investing
Let's contrast position trading with other styles to see how it operates in practice:
| Parameter | Swing Trading | Position Trading | Value Investing |
|---|---|---|---|
| Time Horizon | 2 to 20 Days | 3 to 18 Months | 3 to 10+ Years |
| Primary Tool | Technical indicators, short-term charts (Daily / 1-hour). | Macro trends, earnings growth, long-term charts (Weekly). | Balance sheet analysis, DCF valuation, management meetings. |
| Trade Trigger | Moving average crossovers, support/resistance bounce. | Stage 2 weekly breakout + structural earnings growth. | Stock trading significantly below intrinsic value. |
| Exit Strategy | Reaching swing target or trailing stop (e.g., 20 EMA). | Break of weekly trend (e.g., 30-week SMA) or deteriorating earnings. | Company fundamentals decay or valuation becomes highly irrational. |
How to Execute a Position Trading System
If you want to construct a systematic position trading routine, apply the following steps:
Step 1: Identify Macro Themes
Look for major structural shifts in the economy. For example, is there a massive government push for infrastructure spending? Is the manufacturing sector benefit from national incentives (like the PLI scheme)? Identify the sectors that are poised to receive massive tailwinds over the next 2-3 years.
Step 2: Fundamental Screening
Scan the chosen sectors for the strongest players. Focus on growth metrics:
- Quarter-on-quarter and year-on-year sales and profit growth (ideally > 20%).
- High return on equity (ROE > 15%) and return on capital employed (ROCE > 20%).
- Clean balance sheets with low, manageable debt-to-equity ratios.
Step 3: Technical Timing (The Base Breakout)
Open the weekly chart of the fundamentally strong stock. Wait for it to consolidate in a Stage 1 base (e.g., a cup and handle pattern or flat base) for at least 6 to 12 months. Buy the stock when the weekly price breaks out above the base resistance on high weekly volume, marking the official transition into a Stage 2 uptrend.
Step 4: Trail and Hold
Once you are in, sit tight. Do not sell because the stock has gone up 30% and you are tempted to book profits. A true Stage 2 run can last for months, yielding 100%, 200%, or even 500% returns (multi-bagger runs). Trail your stop loss below the rising 30-week or 40-week Moving Average. Only exit the trade when the weekly candle closes below this key long-term line, indicating the trend has ended.
Conclusion
Position trading is one of the most rewarding, peaceful, and wealth-maximizing trading styles available. By marrying structural earnings growth with long-term chart trends, it allows you to filter out the daily noise of the market and ride massive institutional waves. It requires you to be patient, think like a business owner, and possess the discipline to let your winning positions double and triple without cutting them short. Identify the macro trend, buy the breakout, trail your weekly moving averages, and ride the train to your destination.
Educational & Regulatory Disclaimer
This publication is created strictly for educational and financial literacy purposes. InnocentInvestor is not a SEBI-registered investment advisor or research analyst. Stock market investments are subject to market risks; please consult a qualified financial planner before making investment decisions.
