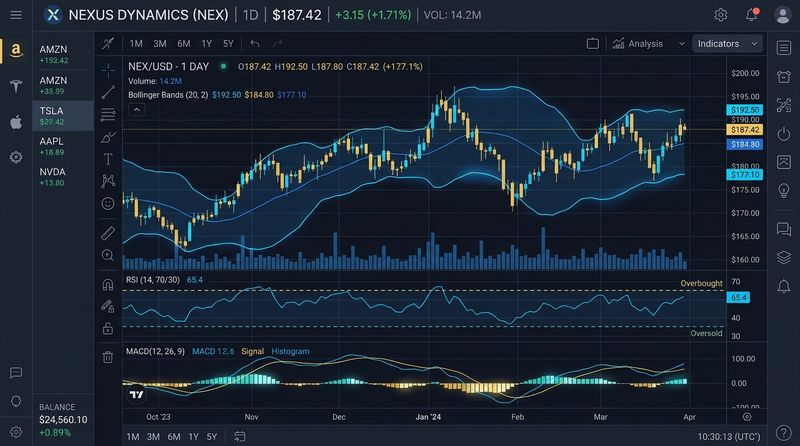
Have you ever bought a stock right when it felt like it was flying to the moon, only for it to reverse and head straight down the moment you hit "Buy"? Or perhaps you sold a stock in panic after a long correction, only to watch it launch into a massive rally the next day? If these situations sound familiar, you are not alone. Timing the market is one of the hardest challenges for retail investors, but momentum indicators like the Relative Strength Index (RSI) are designed to give us a clearer view of the price action.
The RSI is a classic tool used by traders to determine whether a stock is being aggressively accumulated or dumped. Developed by J. Welles Wilder Jr. in his seminal 1978 book, New Concepts in Technical Trading Systems, the RSI remains one of the most widely used and reliable technical tools today. But simply reading the numbers on a screen isn't enough; you must understand the underlying psychology to use it effectively.
What is the Relative Strength Index (RSI)?
At its core, the RSI is a momentum oscillator. This means it measures the speed and change of price movements, plotting the results on a scale from 0 to 100. It doesn't tell you the trend's direction directly, but it indicates the strength of the current price push.
To understand the logic behind the RSI, think of a moving car. If a car is speeding down a highway, it cannot stop instantly. It must slow down first. Momentum is the car's speed. In the stock market, momentum usually starts to decline before the stock price itself changes direction. The RSI is designed to measure this hidden deceleration, warning you of potential reversals before they happen on the price chart.
How is the RSI Calculated?
While modern charting software calculates the RSI automatically, understanding the formula helps demystify the indicator. The RSI is calculated using a two-step formula:
Where RS (Relative Strength) is the average of 'N' days' up closes divided by the average of 'N' days' down closes. By standard convention, Wilder used a 14-day lookback period. The formula normalizes the price moves so that the indicator always oscillates within a fixed band of 0 to 100, making it easy to compare different stocks regardless of their share prices.
The Traditional Rules: Overbought vs. Oversold
The most basic application of the RSI involves identifying extreme price extensions. The chart is divided into three zones:
- Overbought Zone (RSI > 70): This indicates that the price has risen too quickly and may be due for a correction, pullback, or consolidation.
- Neutral Zone (RSI between 30 and 70): The price is moving within standard parameters.
- Oversold Zone (RSI < 30): This indicates that the price has fallen too sharply and may be ripe for a technical bounce or reversal.
The Golden Caveat: A common amateur mistake is buying immediately when the RSI drops below 30 or selling the second it crosses above 70. In strong trending markets, the RSI can remain overbought or oversold for weeks. For example, during a powerful bull run, a high-growth stock can ride an RSI of 80 all the way up. Buying an oversold stock in a dying industry will often lead to catching a falling knife. Instead of acting on the touch of these zones, experienced traders wait for the indicator to exit the zone as a sign of confirmed reversal.
Advanced Trading Strategy: RSI Divergence
Divergence occurs when the price movement on the chart disagrees with the movement of the RSI indicator. This is one of the most powerful warning signs of an impending trend change because it shows that momentum is weakening even as the price makes new extremes.
1. Bullish Divergence
A bullish divergence occurs when the stock price makes a lower low (continuing the downtrend), but the RSI makes a higher low. This indicates that while sellers are still pushing the price down, their selling pressure is losing steam. It suggests a potential shift from bear control to bull control.
2. Bearish Divergence
A bearish divergence occurs when the stock price makes a higher high (continuing the uptrend), but the RSI makes a lower high. This tells you that despite the higher price print, the buying volume and velocity are drying up. The trend is exhausted and vulnerable to a sell-off.
| Divergence Type | Price Behavior | RSI Behavior | Market Bias |
|---|---|---|---|
| Bullish Divergence | Makes a Lower Low | Makes a Higher Low | Buy / Long Bias |
| Bearish Divergence | Makes a Higher High | Makes a Lower High | Sell / Short Bias |
Welles Wilder’s Swing Failure Strategy
To avoid false signals in overbought and oversold conditions, Wilder proposed the Swing Failure Strategy. This is a purely indicator-driven setup that ignores price action peaks and valleys, looking instead at the shape of the RSI itself. Here is how a Bullish Swing Failure is traded:
- The RSI drops below the oversold line (30).
- The RSI bounces back above 30.
- The RSI pulls back down but holds above 30, establishing a higher low (this is the fail).
- The RSI breaks above its previous peak. This breakout point serves as the trigger for a long position.
The inverse setup is used for a Bearish Swing Failure to short a stock or exit a long-term holding. By waiting for the higher low to form above 30, you filter out a large percentage of false bottom-picking signals.
Practical Implementation and Risk Management
While the RSI is highly effective, it should never be used in isolation. To build a robust trading system, combine it with other technical indicators. For example, you can use a 200-day Simple Moving Average (SMA) to identify the major trend. Only buy bullish RSI signals when the price is trading above the 200 SMA, ensuring you are trading in the direction of the dominant market force.
Additionally, always protect your capital by setting volatility-based stop-losses using the Average True Range (ATR) indicator. No technical setup is 100% accurate, and professional trading is about keeping your losses small when you are wrong and letting your gains compound when you are right.
Action Plan for Retail Investors
- Start with a demo: Open your charting platform and plot the 14-day RSI on Nifty 50 or your favorite large-cap stocks. Observe how the RSI reacted during past market corrections.
- Adjust your settings: For index trading, some professionals change the overbought/oversold boundaries from 70/30 to 80/20 during strong bull markets to filter out minor pullbacks.
- Practice divergence hunting: Train your eyes to spot the mismatch between price peaks and RSI peaks. Note down how many times a bearish divergence preceded a correction.
Conclusion
The Relative Strength Index is a powerful, mathematically sound tool that translates price velocity into a visual oscillator. By mastering overbought and oversold dynamics, spotting divergences, and applying swing failure entry triggers, you can trade market reversals with greater confidence. Remember to align your trades with the primary trend, manage your risks with a disciplined stop-loss policy, and continuously monitor your execution parameters.
Educational & Regulatory Disclaimer
This publication is created strictly for educational and financial literacy purposes. InnocentInvestor is not a SEBI-registered investment advisor or research analyst. Stock market investments are subject to market risks; please consult a qualified financial planner before making investment decisions.
