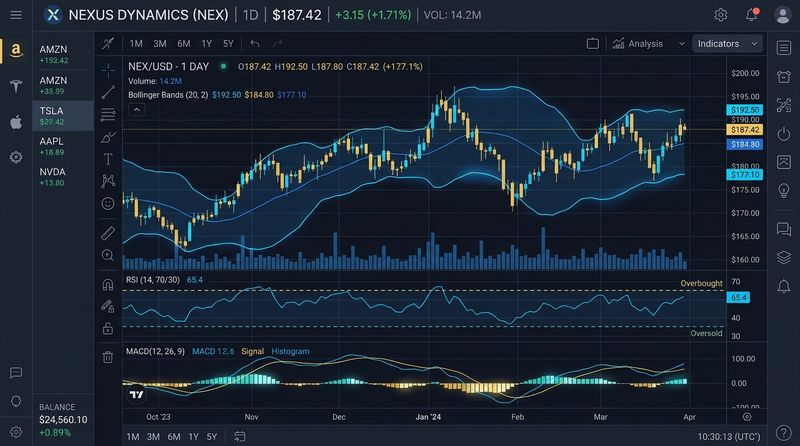
Have you ever watched a pendulum swinging? As it climbs toward its peak, gravity slows it down until it stops completely and swings backward in the opposite direction. The stock market moves in a very similar fashion. In range-bound markets, price rises until buying pressure dries up, pauses, and then swings downward. The Stochastic Oscillator is a momentum tool designed to measure where the price is relative to its high-low range over time, helping traders spot these pendulum-like market reversals.
Developed by legendary trader George Lane in the late 1950s, the Stochastic Oscillator is based on a simple observation: during an uptrend, prices tend to close near their high of the day. Conversely, during a downtrend, prices tend to close near their low of the day. By measuring where the current close is relative to the high-low range over a specific period, the Stochastic Oscillator indicates whether the market is overextended and ready to reverse.
The Structure and Math Behind Stochastics
The Stochastic Oscillator consists of two lines—the %K line and the %D line—and operates on a scale from 0 to 100. By default, the lookback period is set to 14 periods.
1. The %K Line (The Fast Line)
The %K line represents the current close relative to the high-low range of the last 14 periods. The mathematical formula is:
Where the "Lowest Low" and "Highest High" are the extremes recorded during the 14-period lookback. This line reacts quickly to recent price changes.
2. The %D Line (The Slow Line)
The %D line is a smoothed version of the %K line. It is a 3-period Simple Moving Average of %K. Because it is smoothed, it moves slower and acts as a signal line. A crossover between the %K and %D lines is one of the primary entry signals.
Fast, Slow, and Full Stochastics
Most charting platforms offer three versions of this indicator. Understanding the differences is critical to avoiding noise:
- Fast Stochastics: Uses the raw %K and %D calculations. Because it is highly sensitive, it produces many false signals and is rarely used by professional traders.
- Slow Stochastics: Smooths the fast %K line with a 3-period SMA, and then calculates the %D line. This is much smoother and more reliable.
- Full Stochastics: A fully customizable version that allows you to specify the lookback period, the smoothing factor for %K, and the smoothing factor for %D.
Classical Trading Strategies Using Stochastics
Traders look for three main signals when using the Stochastic Oscillator to time reversals:
1. Overbought and Oversold Reversals
The Stochastic boundaries are set at 80 and 20, rather than the 70/30 used by the RSI. When the oscillator is above 80, the market is considered overbought. When it is below 20, it is oversold.
To enter a trade, wait for the %K line to cross the %D line and exit the extreme zone:
- Buy Signal: Wait for the Stochastic lines to drop below 20. When the %K line crosses above the %D line, and both lines rise above 20, enter a long trade.
- Sell Signal: Wait for the Stochastic lines to rise above 80. When the %K line crosses below the %D line, and both lines drop below 80, exit long positions or enter a short trade.
2. Stochastic Divergence
Stochastic divergence is a highly reliable reversal signal in range-bound markets. A bullish divergence forms when the price makes a lower low, but the Stochastic oscillator holds a higher low. This indicates that despite the falling price, selling momentum is exhausted, and a rebound is likely.
| Signal Type | Stochastic Line Crossover | Boundary Action | Action Bias |
|---|---|---|---|
| Bullish Crossover | %K crosses above %D line | Both lines cross above 20 | Buy Entry / Long |
| Bearish Crossover | %K crosses below %D line | Both lines cross below 80 | Sell Exit / Short |
Risk Management: Filtering Whipsaws
The primary weakness of the Stochastic Oscillator is that it can remain locked in overbought or oversold territory for long periods during strong trends. During a powerful bull run, the Stochastic lines can stay above 80 for weeks. Shorting the market simply because the Stochastic is overbought is an easy way to lose capital.
To avoid these false signals, always trade in the direction of the dominant market trend. Use a 200-day Simple Moving Average (SMA) as a filter. If the price is above the 200 SMA (uptrend), only take bullish crossovers that occur in the oversold zone (below 20). Ignore all bearish crossover signals, as they represent minor pullbacks in a major bull market.
Practical Action Steps for Traders
- Set up Slow Stochastics: Configure your charting platform to use the Slow Stochastic indicator with settings of (14, 3, 3). This filters out random market noise.
- Analyze the daily chart: Daily Stochastic signals are far more reliable than intra-day signals. Avoid trading five-minute Stochastic crossovers, as they are prone to whipsaws.
- Combine with support/resistance: Only take a bullish Stochastic crossover if the price is also touching a significant support zone, such as a major horizontal line or a key moving average.
Conclusion
The Stochastic Oscillator is a highly effective momentum indicator that helps traders spot overextended price conditions and time reversals. By understanding how the %K and %D lines interact, waiting for crossovers to exit extreme zones, and filtering signals through long-term trends, you can improve your market timing. Remember to combine Stochastics with reliable price structure and disciplined stop-loss placement.
Educational & Regulatory Disclaimer
This publication is created strictly for educational and financial literacy purposes. InnocentInvestor is not a SEBI-registered investment advisor or research analyst. Stock market investments are subject to market risks; please consult a qualified financial planner before making investment decisions.
