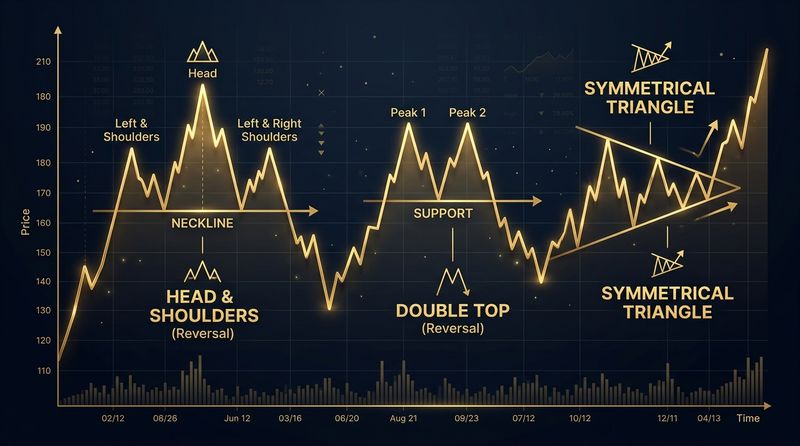
Walk into any trading floor or open any charting software, and the very first thing you will notice is a series of lines drawn across the screen. While complex mathematical indicators like MACD, RSI, or Bollinger Bands often steal the spotlight, seasoned professional traders know a secret: the most powerful tools in technical analysis are also the simplest. Among these, none are more critical than Support and Resistance.
Support and resistance are the bedrock of price action trading. They are not merely lines on a screen; they represent the collective psychological battles of buyers and sellers at specific price levels. Understanding these concepts allows retail traders to step away from guessing and start trading based on real supply and demand dynamics.
The Psychology Behind the Lines
To understand support and resistance, we must first abandon the idea that market movements are random. Markets are driven by human beings (and algorithms programmed by human beings) who possess memory, greed, and fear. When the price of a stock reaches a certain level and reverses, that level becomes etched into the collective memory of the market.
What is Support?
Imagine a stock falling from $150 down to $100. At $100, the price stops falling and begins to climb back up to $120. Why did this happen? At $100, buyers saw the stock as "cheap" or undervalued, stepping in with large purchase orders. Simultaneously, short-sellers who sold at $150 began buying shares to cover their positions and lock in profits. This surge in buying pressure absorbed all the selling supply, driving the price up.
Support is the price level at which demand is strong enough to prevent the price from falling further. On a chart, it acts like a floor.
What is Resistance?
Now, imagine the stock rises back to $120. Suddenly, the upward momentum stalls, and the price begins to decline. At $120, sellers saw the stock as overvalued and started dumping shares. Buyers who had purchased at $100 decided to take their profits. This influx of supply overwhelmed demand, pushing the price down.
Resistance is the price level at which supply is strong enough to prevent the price from rising further. On a chart, it acts like a ceiling.
The Paradigm Shift: Support and Resistance Zones
One of the most common mistakes retail traders make is treating support and resistance as exact, single price points. For example, if a trader draws support at exactly $100.00, they might panic and sell when the price dips to $99.60, only to watch the price shoot back up.
In reality, the market does not operate with surgical precision. Support and resistance are zones or areas of interest. Think of them as a thick rug rather than a thin wire. Due to market noise and minor order flow imbalances, the price will frequently breach the level slightly before reversing. By drawing your levels as rectangular zones rather than single lines, you reduce the risk of getting caught in market noise.
Horizontal (Static) vs. Dynamic Levels
While dynamic levels (like moving averages or trendlines) change as time progresses, horizontal levels—often called static levels—are determined solely by historical price interactions. Static horizontal levels are considered the most reliable because they do not depend on mathematical formulas or indicators; they are pure representations of past structural shifts in price.
How to Draw Support and Resistance Zones Accurately
Drawing clean, reliable zones is an art form that requires practice. Follow these three rules to keep your charts clean and highly actionable:
- Focus on Major Swing Highs and Swing Lows: Look for points where the price made a dramatic, sharp reversal. The sharper the reversal, the stronger the supply/demand imbalance at that level.
- Look for Multiple Touches: The more times a price level has been tested and held, the more significant that level is. A level that has held three times is far more reliable than one that has only held once.
- Use Line Charts to Clear the Noise: If you find candlestick wicks distracting, switch your chart to a line chart. A line chart only shows closing prices, helping you see the core structural turning points of the market.
Three Essential S&R Trading Strategies
Once you have identified these key structural zones, you can build reliable trading setups around them. Here are the three classic ways to trade support and resistance:
1. The Range Play (The Bounce)
When a market is consolidating sideways, it bounces between a clear support floor and a resistance ceiling. Traders can buy at support and sell at resistance.
How to execute: Wait for the price to drop into the support zone. Look for a bullish reversal candlestick (like a hammer) to confirm that buyers are stepping in. Enter long, placing your stop loss just below the support zone, and set your target near the resistance ceiling.
2. The Breakout Trade
Eventually, a range will break. A breakout occurs when the price decisively closes outside of a support or resistance level. A breakout above resistance suggests that buyers have completely overwhelmed sellers and the trend is turning bullish.
How to execute: Do not buy the exact moment the price crosses the resistance line, as this leads to buying "fakeouts." Instead, wait for a daily or hourly candlestick to close cleanly above the resistance zone. Enter on the close of that candle, placing a stop loss back inside the range.
3. The Role Reversal (The Pullback)
One of the most reliable rules of price action is that broken resistance becomes new support, and broken support becomes new resistance. When the price breaks out of resistance, sellers who missed the move will wait for the price to return to the breakout point to buy.
How to execute: After a strong breakout, wait for the price to pull back to the broken level (the "retest"). Enter your trade when the price shows rejection wicks at this level, confirming it is now holding as support.
Summary of Support & Resistance Behaviors
| Concept | Market Meaning | Trader Behavior | Stop-Loss Placement |
|---|---|---|---|
| Support Zone | Excess demand; buyers absorb supply. | Look for buying opportunities. | Just below the lowest wick of the zone. |
| Resistance Zone | Excess supply; sellers absorb demand. | Look for short-selling or profit-taking. | Just above the highest wick of the zone. |
| Breakout | Structural shift; range is resolved. | Trade in the direction of the breakout. | Inside the broken zone or range midpoint. |
| Retest / Role Reversal | Confirmation of the new support or resistance. | Enter on pullback to broken level. | Below/above the retested zone boundary. |
Common Pitfalls and How to Avoid Them
- Chasing Breakouts: Entering a trade late in a breakout often results in buying at the absolute high of a move, just before the price pulls back. Always prioritize entering on the retest or pullback.
- Trading Low-Timeframe Noise: S&R zones on 1-minute or 5-minute charts are incredibly weak and easily broken. Always start your analysis on the Daily (D1) or Weekly (W1) charts to find major levels, then execute on lower timeframes (1-hour or 15-minute).
- Ignoring Market Context: Do not try to buy support in a raging bear market. Trends will easily break support levels. S&R works best when traded in alignment with the broader market trend.
Conclusion
Support and resistance trading is not about predicting the future. It is about identifying high-probability areas on your chart where the risk-to-reward ratio is in your favor. By learning to identify these key structural zones, patience will naturally follow. You will stop chasing the market and instead wait for the price to come to your pre-determined zones of value, transforming your trading from an emotional guessing game into a disciplined business.
Educational & Regulatory Disclaimer
This publication is created strictly for educational and financial literacy purposes. InnocentInvestor is not a SEBI-registered investment advisor or research analyst. Stock market investments are subject to market risks; please consult a qualified financial planner before making investment decisions.
