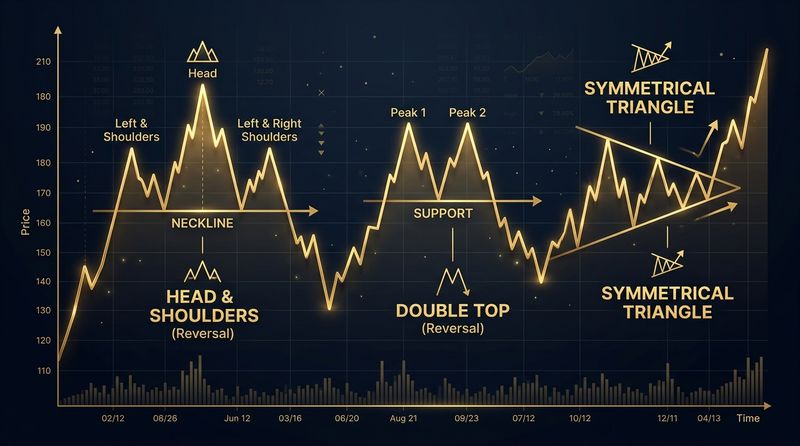
Imagine compressing a heavy metal spring. The tighter you squeeze it, the more potential energy it stores. When you finally release your hand, the spring explodes outward with violent force. In the financial markets, Triangle Patterns represent this exact phenomenon. They are areas of intense price compression where the market range contracts, storing momentum until it bursts out in a volatile breakout.
Triangles are foundational technical patterns that indicate a pause or consolidation in the market before a decisive move. Understanding the three primary types of triangles—Ascending, Descending, and Symmetrical—gives retail traders the ability to read market compression, anticipate high-velocity breakouts, and structure clean risk-to-reward setups.
1. The Symmetrical Triangle (The Squeeze of Indecision)
A Symmetrical Triangle is characterized by two converging trendlines: a downward-sloping resistance line and an upward-sloping support line. During its formation, the price makes lower highs and higher lows, pinching closer to the "Apex" (the point where the lines meet).
Market Psychology
This pattern represents complete indecision in the market. Sellers are willing to accept lower prices to exit, while buyers are willing to pay higher prices to enter. Neither group is dominant. As a result, the market compresses. Because the forces are balanced, a Symmetrical Triangle is a **bilateral pattern**—it can break out in either direction. Traders must wait for the breakout to confirm who won the battle.
2. The Ascending Triangle (The Bullish Pressure Cooker)
An Ascending Triangle consists of a flat horizontal resistance level on top and an upward-sloping support line on the bottom. The price makes higher lows while repeatedly hitting the same resistance ceiling.
Market Psychology
This is a highly bullish accumulation pattern. The horizontal resistance ceiling represents a large supply of sell orders at a specific price. However, notice the higher lows: every time the price drops, buyers step in earlier and earlier. They are aggressive and willing to buy at higher prices. This rising support line pushes the price against the ceiling. Eventually, the sell orders at resistance are completely absorbed, and the price explodes upward.
3. The Descending Triangle (The Bearish Cascade)
A Descending Triangle is the inverse of the Ascending Triangle. It consists of a flat horizontal support floor on the bottom and a downward-sloping resistance line on the top. The price makes lower highs while repeatedly bouncing off the same support floor.
Market Psychology
This is a bearish distribution pattern. The flat support line represents buyers trying to defend a specific floor. However, on each bounce, the rallies are weaker and peak at lower levels (lower highs). This indicates that sellers are aggressive, dumping shares at lower and lower prices. The downward-sloping line pushes the price against the floor. Eventually, the buying demand at support is exhausted, and the price collapses downward.
Comparison: The Triangle Triad
| Triangle Type | Structure | Default Bias | Preferred Entry Trigger |
|---|---|---|---|
| Symmetrical | Lower highs & higher lows. | Neutral (Bilateral). | Candlestick close outside either trendline. |
| Ascending | Flat resistance & higher lows. | Bullish. | Candlestick close above horizontal resistance. |
| Descending | Flat support & lower highs. | Bearish. | Candlestick close below horizontal support. |
How to Trade Triangles Safely
Trading triangles requires patience. Entering while the price is still bouncing inside the triangle is highly risky because the pattern can decay into sideways noise. Follow this systematic setup:
Step 1: Wait for a Decisive Closing Breakout
A breakout is confirmed when a candlestick close is established outside the triangle's boundaries. Do not trade intraday spikes that cross the line but close back inside the pattern (wick rejections).
Step 2: Manage the Entry
- Breakout Entry: Enter the trade on the close of the breakout candle.
- Retest Entry: Wait for the price to pull back to the broken trendline or flat level. Enter once the retest is confirmed by rejection candles (e.g., long-wick hammers). This keeps your stop loss tight.
Step 3: Define Your Stop Loss
- For an Ascending Triangle, place your stop loss below the most recent swing low (the last higher low inside the triangle).
- For a Descending Triangle, place your stop loss above the most recent swing high (the last lower high inside the triangle).
- For a Symmetrical Triangle, place your stop loss just past the midpoint of the triangle.
Step 4: Calculate the Target Project
Measure the widest part of the triangle (the base, typically the vertical distance at the start of the pattern). Add or subtract that same height from the breakout point. This projected distance is your logical target. Triangles often run much further, but this target provides a statistically high-probability exit point.
Common Pitfalls and Best Practices
- Beware the Apex Decay: If the price reaches the final 20% of the triangle (very close to the apex) without breaking out, the pattern loses its validity. The price will often drift sideways out of the apex without any momentum. The best breakouts occur between 50% and 75% of the way through the triangle.
- Confirm with Volume: During the formation of the triangle, volume should gradually decline (confirming compression). The breakout candle should be accompanied by a sudden, large spike in volume, signaling institutional backing.
- Trading Against the Bias: While ascending triangles break upward 70% of the time, they can break downward. Never make assumptions. Always wait for the close of the breakout candle before entering a position.
Conclusion
Triangle patterns are excellent trading vehicles because they provide clear, visual maps of market accumulation and distribution. By identifying Symmetrical, Ascending, and Descending structures, waiting for verified candle closes, and projecting your targets mathematically, you can trade market compression with an institutional edge.
Educational & Regulatory Disclaimer
This publication is created strictly for educational and financial literacy purposes. InnocentInvestor is not a SEBI-registered investment advisor or research analyst. Stock market investments are subject to market risks; please consult a qualified financial planner before making investment decisions.
