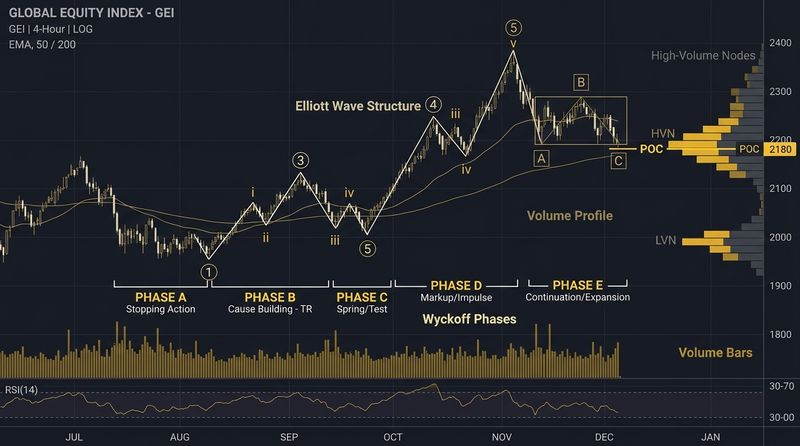
In the early 20th century, Richard Wyckoff stood as one of the most successful active traders on Wall Street. Working alongside legends like Jesse Livermore and J.P. Morgan, Wyckoff realized that retail investors were consistently taken advantage of by "smart money"—the large institutional syndicates that controlled the markets. These major players quietly accumulated shares at low prices, pumped up the stock, distributed their holdings to the public at the peak, and then let the price collapse.
Wyckoff dedicated his life to teaching retail investors how to spot these institutional footprints. He compiled his teachings into a unified framework known as the Wyckoff Method. By treating the market as if it were controlled by a single entity—the "Composite Man"—Wyckoff showed how to track institutional accumulation and distribution phases. Let's explore the core laws of the Wyckoff Method, its four market phases, and how to ride the coattails of smart money.
The Three Laws of Wyckoff
Richard Wyckoff's framework is built upon three fundamental laws that govern price movements and trend developments:
1. The Law of Supply and Demand
This is the primary driver of price. When demand for a stock is greater than supply, price rises. When supply is greater than demand, price falls. Wyckoff traders study the relationship between price bars and volume to determine whether buyers or sellers are winning the battle at any given time.
2. The Law of Cause and Effect
This law states that for there to be an effect (a major price trend), there must first be a cause (a period of preparation). The "cause" is built during consolidation phases:
- An accumulation range is the cause that produces a upward markup trend.
- A distribution range is the cause that produces a downward markdown trend.
3. The Law of Effort vs. Result
This law tracks divergences between volume (effort) and price action (result). If a stock has massive trading volume (high effort) but the price fails to make a new high and closes in a narrow range (low result), it indicates that large sellers are absorbing all the buying pressure. This divergence suggests a trend reversal is near.
The Wyckoff Market Cycle: The Four Phases
According to Wyckoff, the "Composite Man" moves every financial asset through a repeating four-stage cycle:
| Market Phase | Composite Man's Action | Retail Public Behavior | Trading Action |
|---|---|---|---|
| 1. Accumulation | Quietly buys shares within a sideways range. | Panicked, selling out of fear. | Accumulate / Buy near lows. |
| 2. Markup | Pushes price up, breakouts out of accumulation range. | FOMO, starts buying as price runs up. | Hold positions, buy pullbacks. |
| 3. Distribution | Quietly sells shares to late retail buyers. | Highly bullish, buying every minor rally. | Take profits, build short positions. |
| 4. Markdown | Stops supporting price, allows market to fall. | Hoping for a bounce, refuses to cut losses. | Stay in cash / Sell short. |
Anatomy of the Accumulation Phase
To enter at the best possible price, Wyckoff traders study the anatomy of the Accumulation range. Richard Wyckoff divided this range into several phases (A through E), marked by specific price milestones:
- Preliminary Support (PS): Initial buying interest begins to stop the falling price. Volume increases, but the downward momentum is too strong, and the price falls to new lows.
- Selling Climax (SC): A massive panic sell-off on huge volume. Retail investors throw in the towel, and the Composite Man begins to absorb all their panic sales. This level forms the bottom boundary of the trading range.
- Automatic Rally (AR): The panic selling stops, and thin selling pressure allows a quick rally to form. The high of this rally defines the upper boundary of the accumulation range.
- Secondary Test (ST): Price drops back down toward the SC level to test the strength of the remaining supply. If volume is lower on the ST, it indicates supply is drying up.
- The Spring: The ultimate bear trap. The Composite Man pushes the price below the SC support level to trigger retail stop-losses and sweep up remaining shares. The price quickly reverses and climbs back inside the range. This is the highest-probability buy signal.
- Sign of Strength (SOS) & Last Point of Support (LPS): The price rallies out of the range (SOS) and then pulls back to hold the top of the old range (LPS). This confirms that markup has officially begun.
Anatomy of the Distribution Phase
The Distribution phase is the mirror image of Accumulation. It occurs at the end of a long markup trend:
- Preliminary Supply (PSY): Institutional sellers start offloading blocks of shares, causing a pause in the rally.
- Buying Climax (BC): Retail FOMO reaches a peak on positive news. The Composite Man sells massive blocks of shares into this buying frenzy.
- Automatic Reaction (AR): Buying interest dries up, causing a sharp pullback. The low of this reaction forms the bottom of the distribution range.
- Upthrust (UT): The price pushes above the BC high to trap late bulls, but quickly reverses back inside the range.
- Upthrust After Distribution (UTAD): The distribution equivalent of the Spring. A final, aggressive run to new highs to trigger stop-losses of short-sellers before the markdown phase begins in earnest.
How to Trade with the Wyckoff Method
As a retail trader, you don't want to buy during the early stages of Accumulation, because the range can last for months. Instead, wait for these high-probability entries:
1. The Spring Entry
Look for a stock in a long sideways range. When the price breaks down below the range's support, monitor the volume. If volume is average or low, and the price closes back inside the range within 1-2 bars, enter a long position immediately. Place your stop-loss just below the low of the Spring, and target the top of the range.
2. The Sign of Strength (SOS) Breakout Entry
Wait for the price to break out above the resistance line of the accumulation range with high volume. Do not buy the breakout candle. Instead, wait for the pullback (LPS) to test the old resistance level as new support. If it holds, enter long, placing your stop-loss just below the old resistance line.
Conclusion
The Wyckoff Method is a complete, battle-tested blueprint for tracking institutional market cycles. By learning to identify the footprints of the Composite Man during Accumulation and Distribution, you can stop falling victim to bear and bull traps. Master the three laws, study the phase milestones, and trade with the quiet confidence of the smart money.
Educational & Regulatory Disclaimer
This publication is created strictly for educational and financial literacy purposes. InnocentInvestor is not a SEBI-registered investment advisor or research analyst. Stock market investments are subject to market risks; please consult a qualified financial planner before making investment decisions.
